Page History
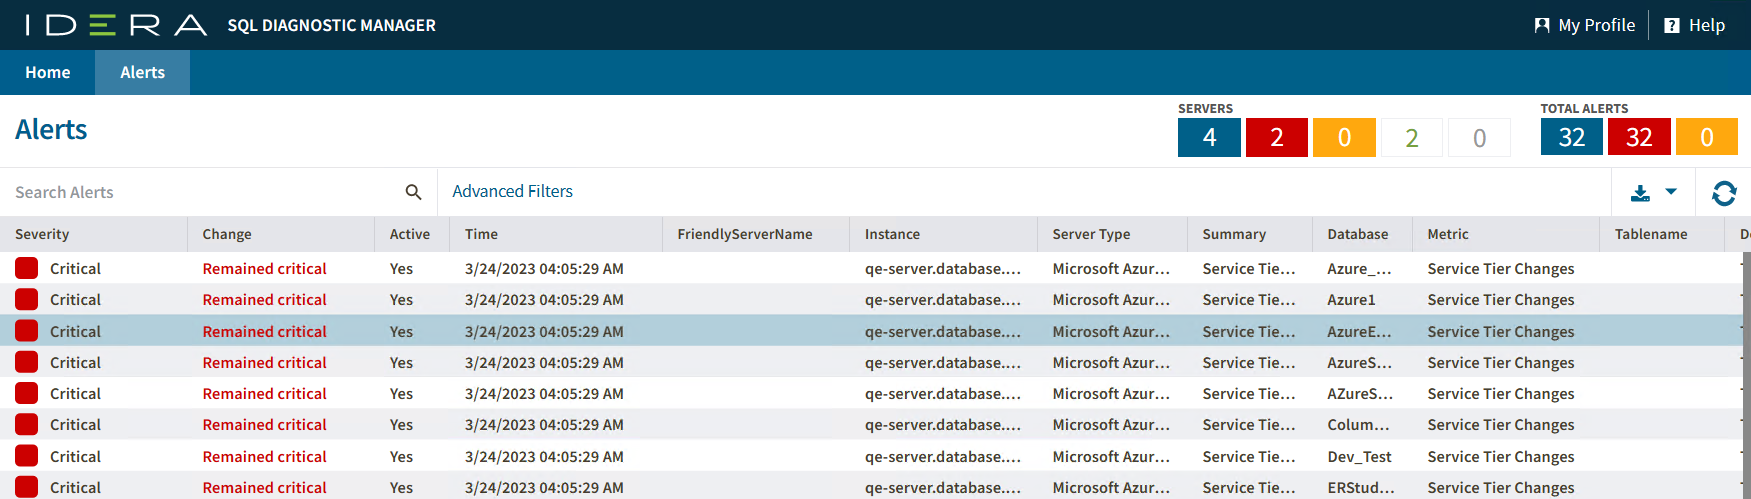
SQLDM Web Console allows you to view all the triggered alerts in a single view in your server's environment. To access this view go to the Alerts tab.
Monitor your alerts by status server
The Alerts tab gives you a summary of the number of servers and alerts of your SQL Server instances grouped by the status server. You can find the status server overview at the right top of the SQLDM Web Console.
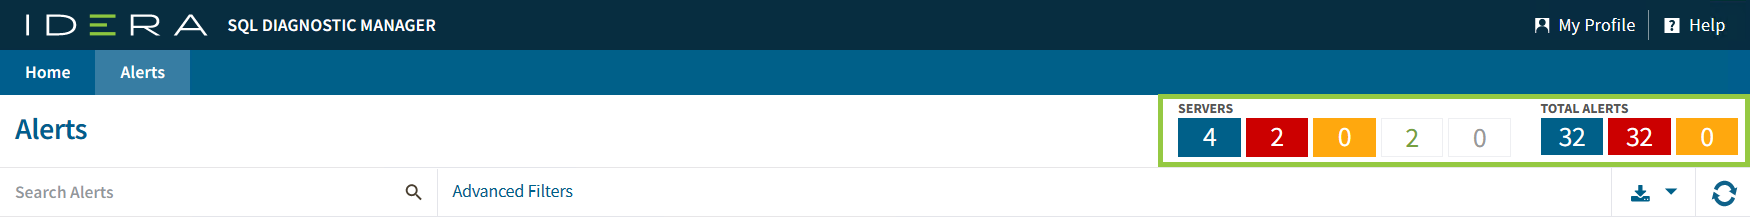
Selecting one of the server status options allows you to filter your alerts. Each option represents a status server:
- All Servers
- Critical
- Warning
- Ok
- Maintenance
SQL Diagnostic Manager includes an improved Dashboard. The Alerts tab of the SQL Diagnostic Manager web console allows you to view all alerts for all the servers in your environment.
...
Organize your alerts
Your alerts are organized under the following columns:
- Active - Organizes all your alerts that are currently active.
- Severity - Organizes all your alerts by their severity (Severity 8, Severity 4, and Severity 1).
- Change
- Active - Organizes all your alerts that are currently active.
- Time
- FriendlyServerName
- Instance - Organizes all your alerts by monitored SQL Server instance.
- Server Type
- Summary
- Database
- Table name
- Details
- Metric - Organizes all your alerts by each of the metrics affected.
- Category - Organizes all your alerts by their category.
- SQLdmRepository - Organizes all your alerts by SQL Diagnostic Manager Repository.
- 12.2 Copy of Advanced Filter
| Note | ||
|---|---|---|
| ||
In the new Alert grid, Severity uses the following numerical values:
|
...