Page History
...
| Info |
|---|
By default, the Query Monitor option is not enabled. |
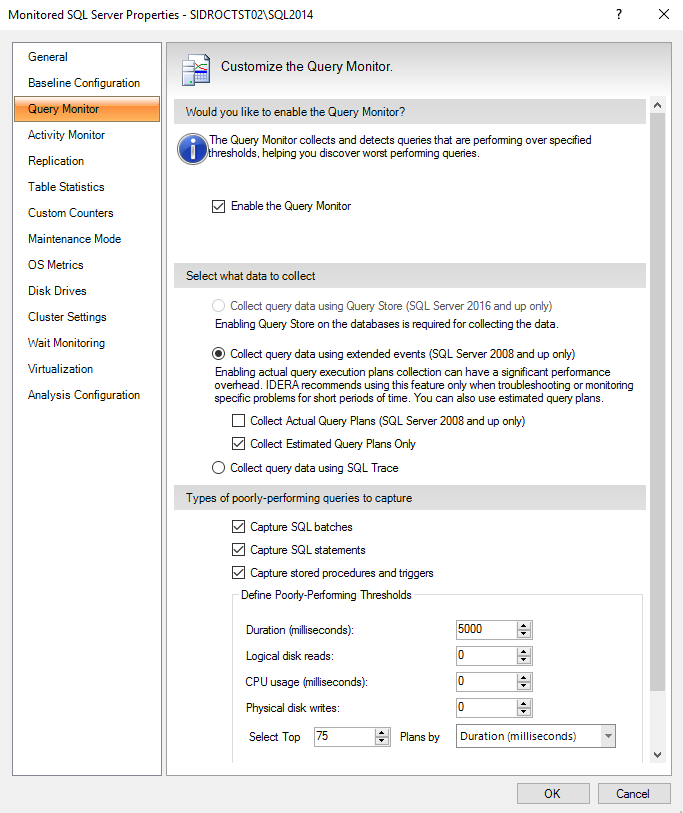

The Query Monitor window allows you to enable or disable query monitoring using the Enable the Query Monitor check box. You can also select the settings that are used:
...
You can select to collect query data using Extended Events (Collect query data using extended events radio button) or SQL Trace (Collect query data using SQL Trace radio button). For instances running SQL Server 2008 or higher, the Query Monitor feature uses by default Extended Events. First introduced in SQL Server 2008, Extended Events provide provides a new mechanism to capture information about events inside the Database Engine and diagnose performance problems. This functionality is highly efficient and lightweight. For more information about using Extended Events, see the Microsoft document,
.Newtablink alias Extended Events url http://msdn.microsoft.com/en-us/library/bb630282.aspx
...
Anchor captpoorlyperfqueries captpoorlyperfqueries
Capturing poorly-performing queries
| captpoorlyperfqueries | |
| captpoorlyperfqueries |
The types of poorly - performing queries to capture include:
...
SQL Diagnostic Manager uses tracing to locate and flag worst-performing T-SQL. SQL Diagnostic Manager cannot display binary data in a readable format. If you captured capture DTS packages, you may see unreadable characters in the Command field of the Tree View. Capturing DTS data DTS data may also adversely affect the performance of the SQL Server SQL Server or Data Warehouse you are monitoring.
...
You can access the Query Monitor tab of the Monitored SQL Server Properties window by right-clicking the appropriate SQL Server instance, and then selecting Properties. Click Query Monitor when SQL Diagnostic Manager displays the Monitored SQL Server Properties window.