The Databases tab of the single instance dashboard contains the Summary, Tempdb, and Tempdb Availability Groups views. The Databases tab allows you to view the status of all the databases on the selected SQL Server instance and , the tempdb database. Click image to view full size.
| Info |
|---|
| title | SQL Workload Analysis |
|---|
|
You can launch SQL Workload Analysis from the SQLDM web console single instance view and its tabs. The icon Launch SWA located on the top-right side of the screen is available when your instance is registered in SQL Workload Analysis product. |
, and the availability groups.
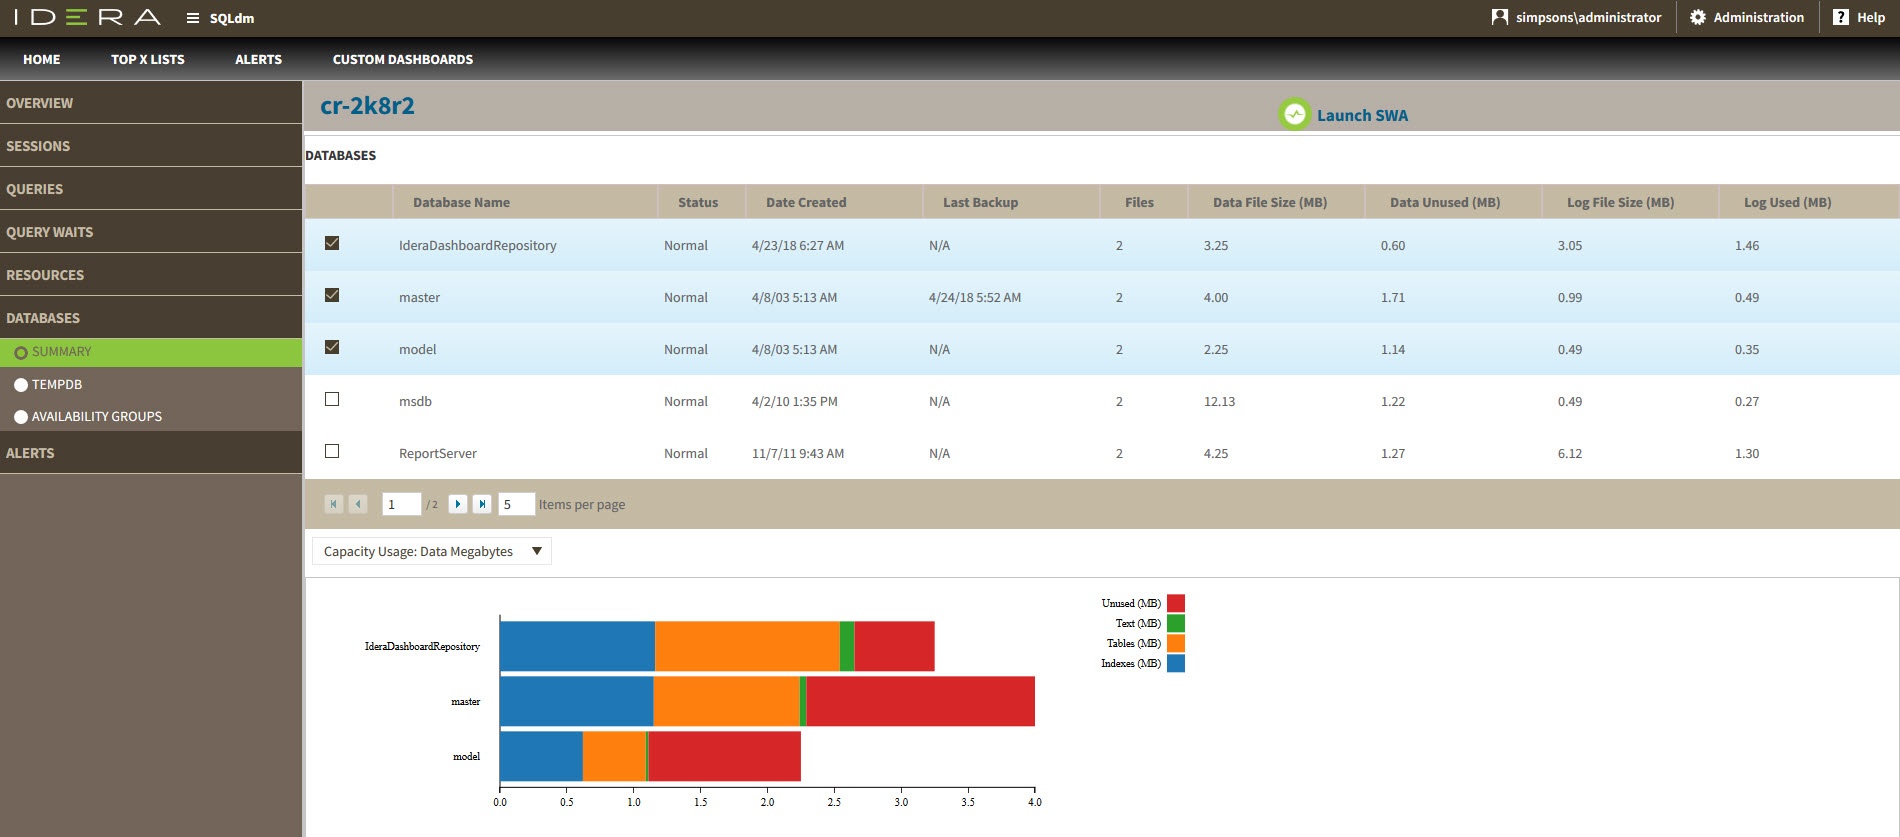 Image Added
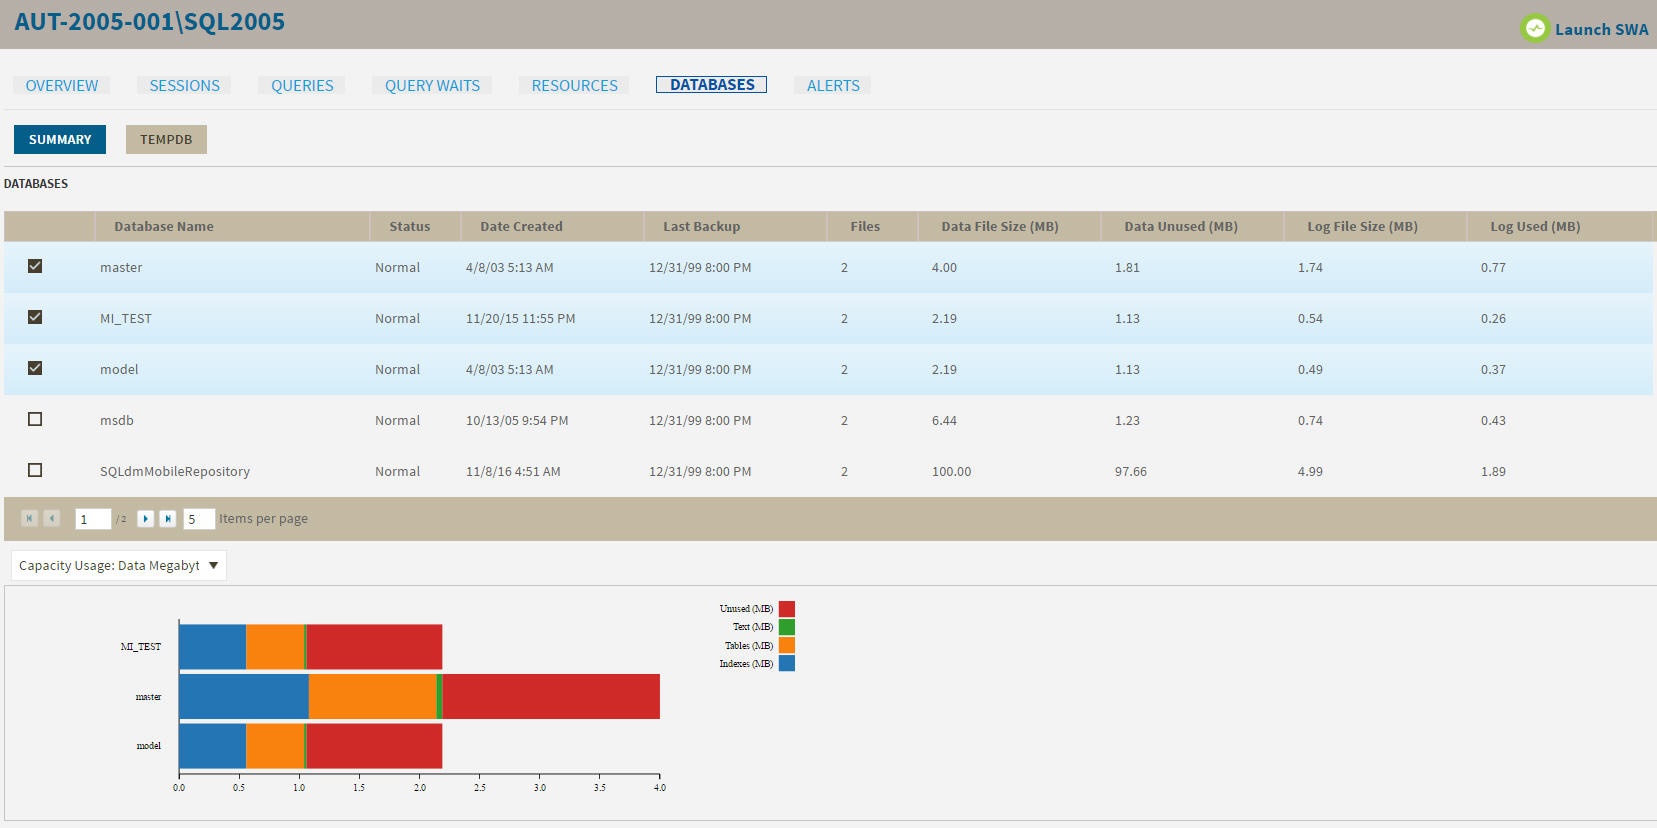 Image Removed
Summary view
The Databases > Summary tab lists each database on the monitored SQL Server instance and provides a large variety of database statistics:
...
| Tip |
|---|
| title | Multi-database selection |
|---|
|
Select multiple databases to display as horizontal stacked bar charts. |
You can choose to view how data or log is used on your database. The Capacity Usage drop-down list allows you to choose data or log in megabytes or percentages. You can select one or more databases in the Databases panel to display in the Capacity Usage chart. This chart provides information on the text, tables, indexes space, as well as the unused space of your database.
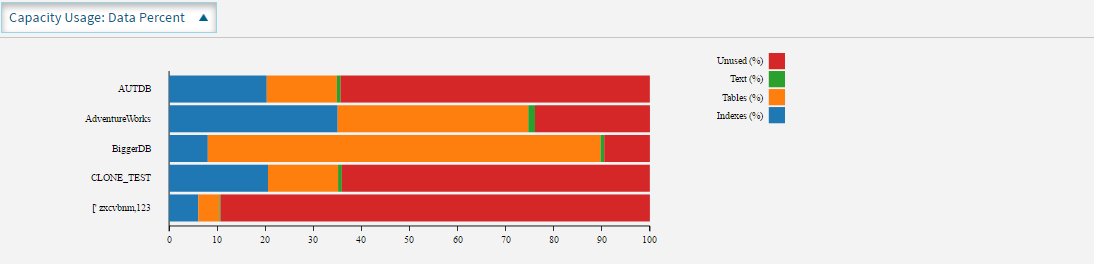 Image Modified
Tempdb view
The Databases > Tempdb tab allows you to view the status of your tempdb database on the selected SQL Server instance. Click image to view full size.
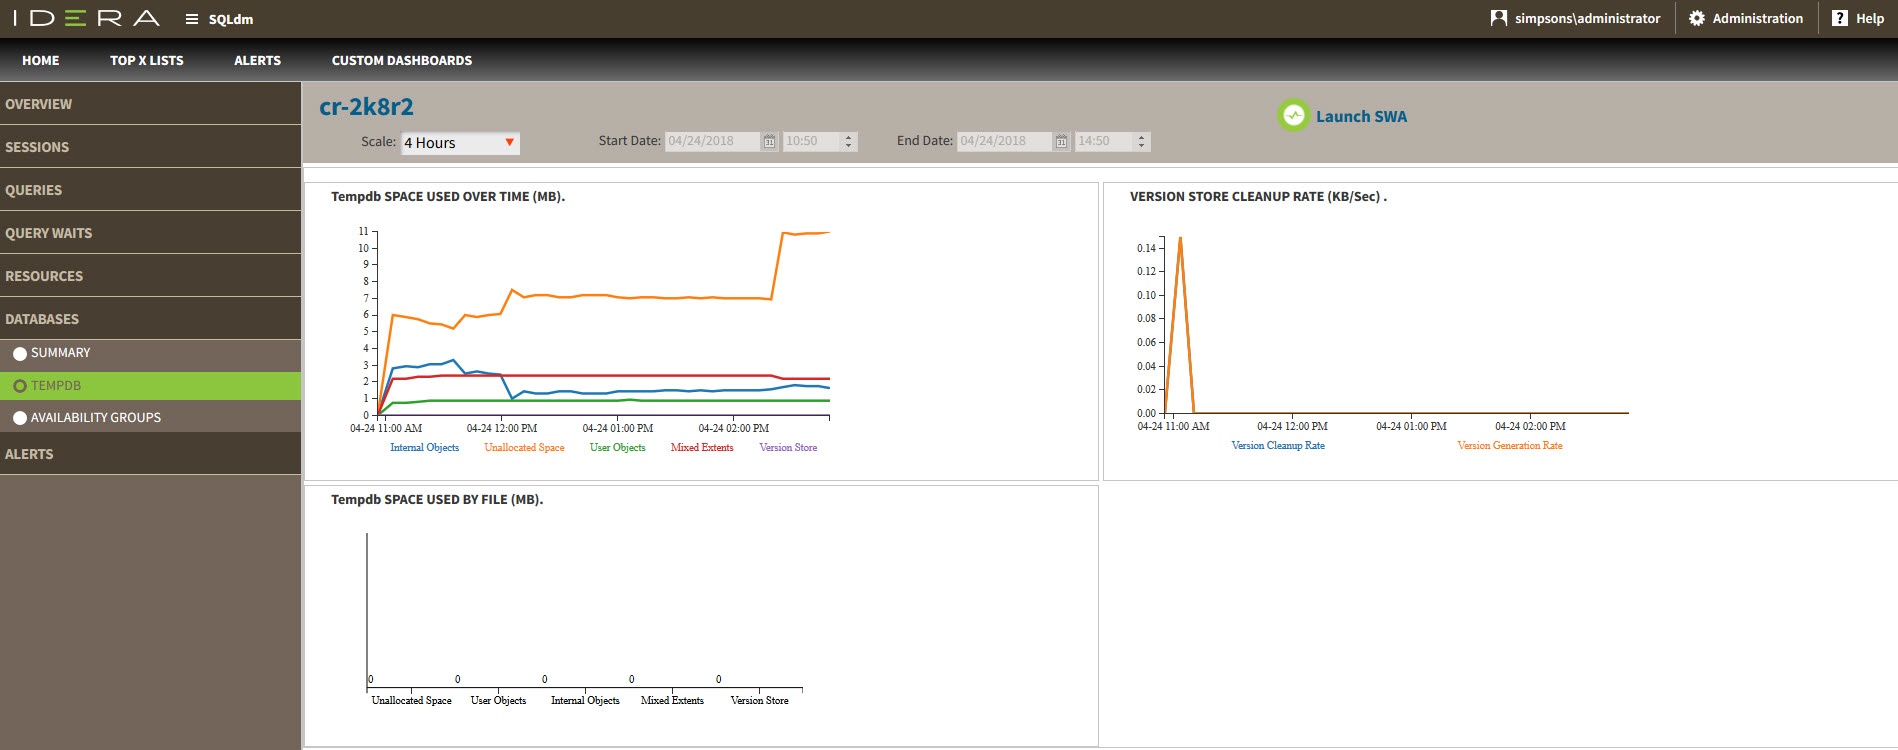 Image Added
 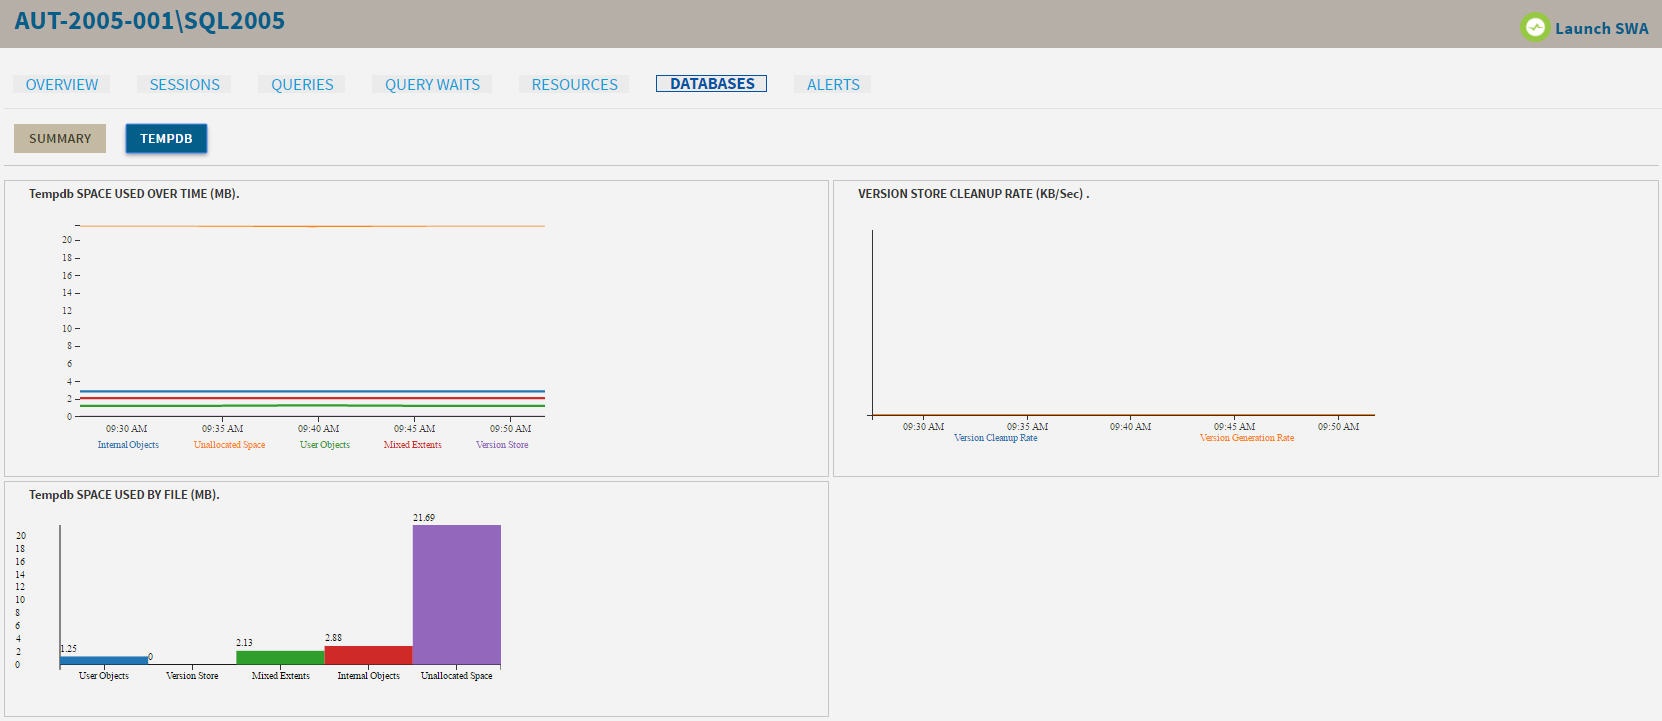 Image Removed
The Tempdb view contains the following charts:
...
For information on each chart, see Get the tempdb status summary.
Availability Groups
The Databases > Availability Groups tab allows you to view the status of your availability groups on the selected SQL Server instance. This tab lists the Availability Groups, with the following description:
- Group Name
- Replica Name
- Replica Role
- Synchronization Health
- Redo Queue
- Redo Rate
- Log Send Queue
- Log Rate
- Database Status
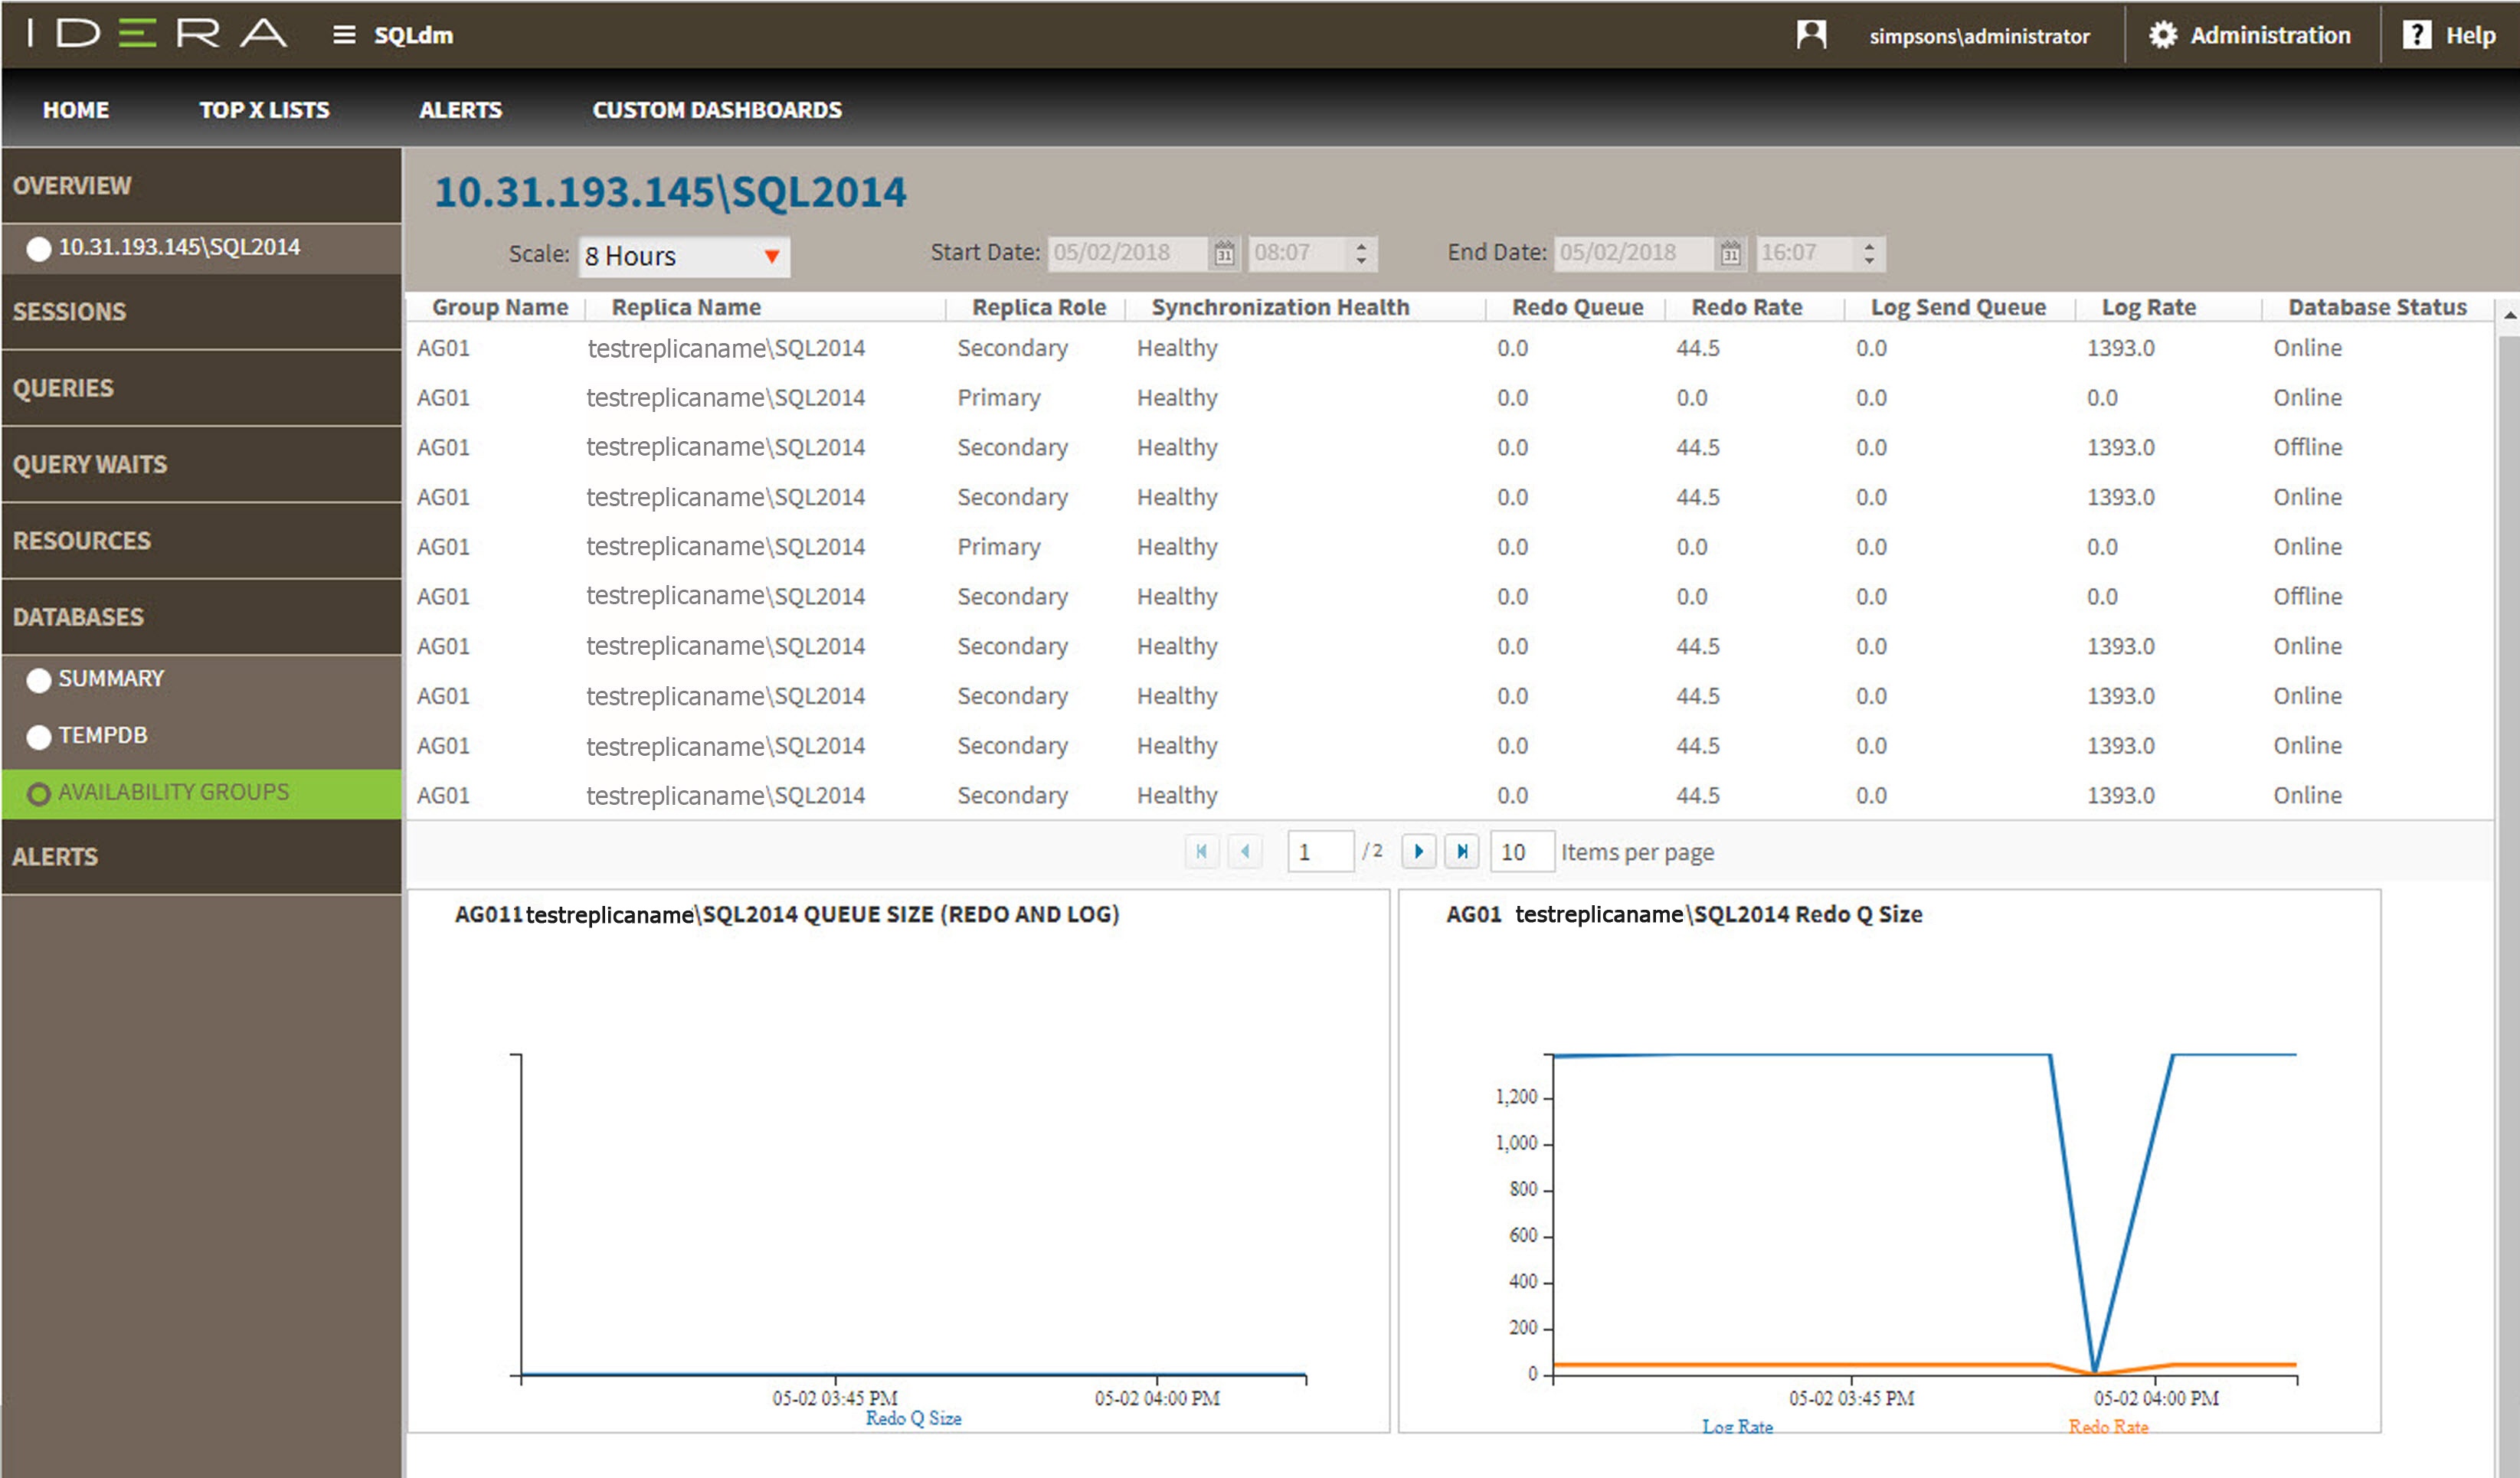 Image Added
Access the Databases tab
The SQL Diagnostic Manager web console provides two paths to access the Databases tab. The first access path is by selecting the Databases tab of the single instance dashboard. You can also click the database category icon of a specific instance in the thumbnail view.