Page History
This procedure guides you through the installation of the IDERA Dashboard and SQL Diagnostic SQLDM Web Console and SQL Diagnostic Manager.
| Note |
|---|
To perform a silent mode installation, see Install SQL Diagnostic Manager in silent mode. |
Start your IDERA SQL Diagnostic Manager installation
You can install the IDERA Dashboard SQLDM Web Console and SQL Diagnostic Manager on any computer that meets or exceeds the product requirements.
To start installing the
...
SQLDM Web Console and SQL Diagnostic Manager:
- Log on with an administrator account to the computer on which you want to install SQL Diagnostic Manager.
- Run
Setup.exein the root of the installation kit. - Click Install SQL Diagnostic Manager on the Quick Start window.
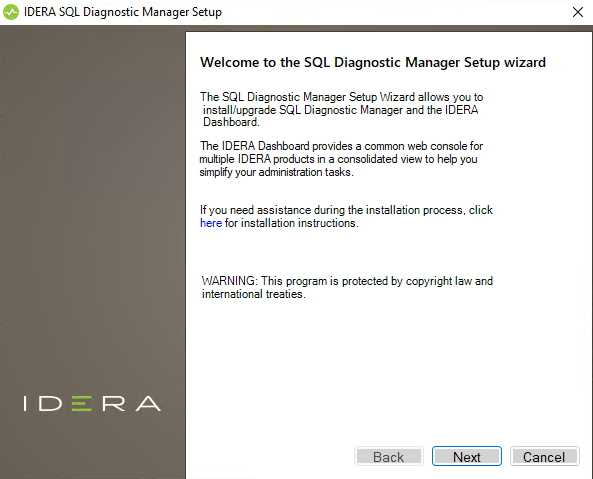
- On the Welcome window of the setup program, click Next.

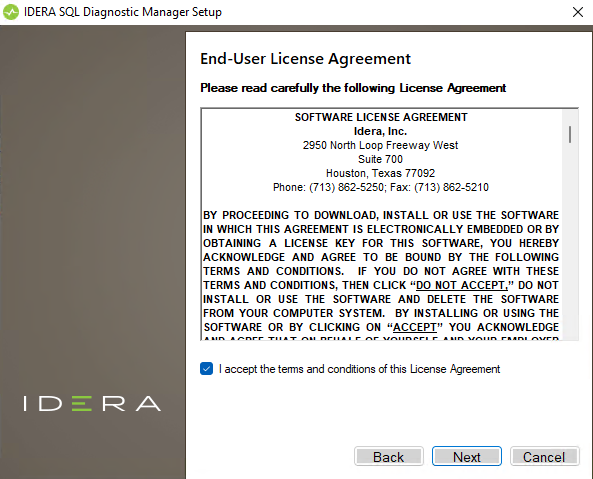
- Review the license agreement. To accept this license agreement, click I accept the terms and conditions of this License Agreement and then click Next.
Choose the components you want to install by selecting the respective check boxes. By default, the setup program installs SQL Diagnostic Manager Windows Console and SQL Diagnostic Manager Services and Repository, allowing you to immediately begin monitoring your SQL Server environment. Select the IDERA Dashboard SQLDM Web Console checkbox if you want a complete installation. By default, by default the SQLDM Web Console is not selected.

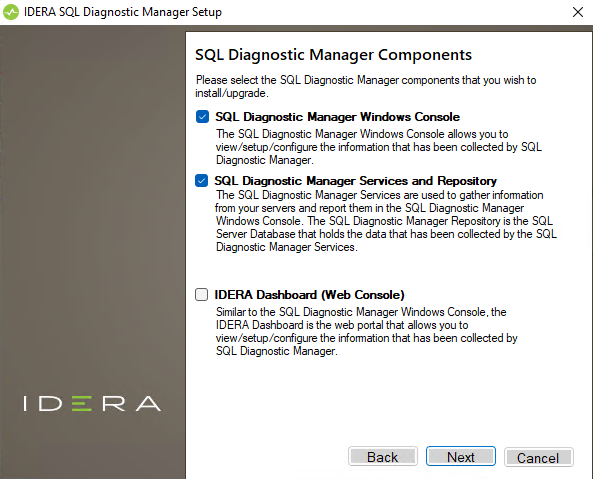
Info By default, the Management Service, Collection Service, Predictive Service, and Rest Service are installed on the local computer where you are running the setup program.
Info Idera SQLDM Web Console is now part of the installation of SQL Diagnostic Manager 12.2 and later versions. However, Idera Dashboard still supports SQL Diagnostic Manager 12.2 and prior versions. If you want to use Idera Dashboard you should manually install it.
- Click Next.
Select a Windows user account to use for the service account
SQL Diagnostic Manager uses the service account to communicate between the monitored SQL Server instance and the SQL Diagnostic Manager Repository. The IDERA Dashboard SQLDM Web Console uses this account to connect, discover, and gather configuration information from SQL Servers in your Business environment. The The installer grants the "Log on as a Service" right to the account that you specify.
...
- On the Service Account window, type appropriate credentials in the provided fields under which the services run.
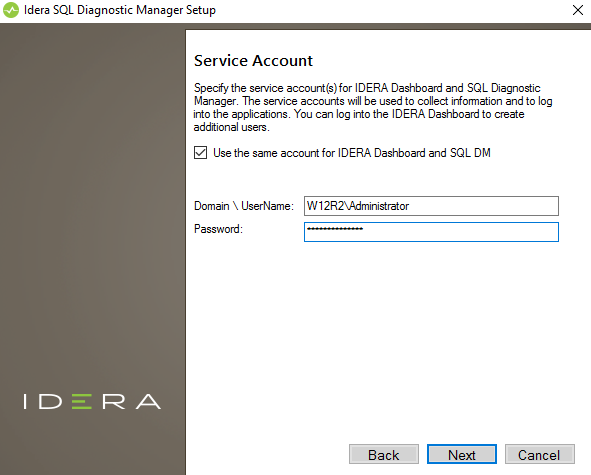

- Click Next. SQL Diagnostic Manager verifies the connection before continuing.
Select service ports to use for the
...
SQLDM Web Console service ports
The IDERA Dashboard SQLDM Web Console uses ports 92929294, 92909295, 9094 9296, and 9291 for 9297 for the web application and dashboard services web services respectively. However, you can specify different service ports.
To specify a service port:
- On the Service Ports window, specify the ports you want the web application and dashboard web console services to use.
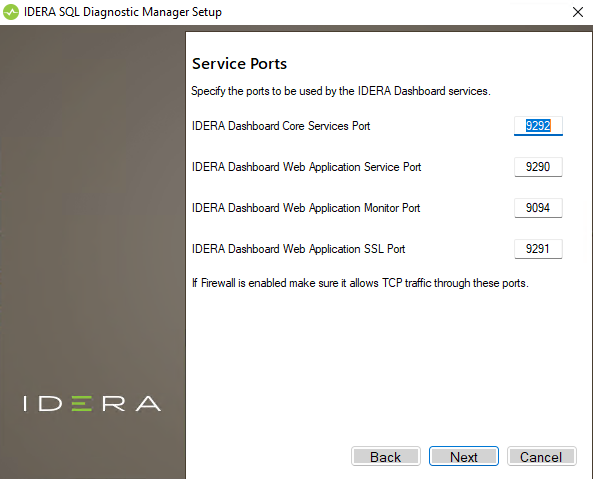
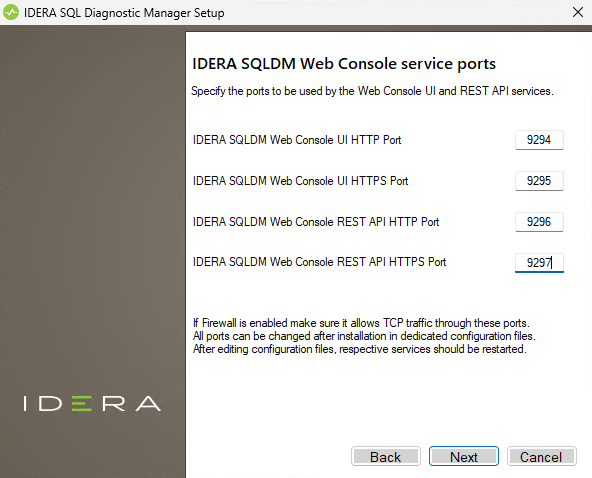
- Click Next.
| Info |
|---|
Verify that the Firewall allows TCP (Transmission Control Protocol) traffic through your specified ports. |
Select a SQL Server instance to use for the
...
SQL Diagnostic Manager Repository database
The IDERA Dashboard SQL Diagnostic Manager Repository is where all the Dashboard's configuration and aggregated data the collected data, alert information, and alert configuration settings are stored.
To specify the SQL Server instance to install the
...
SQL Diagnostic Manager Repository on:
- On
...
- the SQL Diagnostic Manager Repository screen, specify
...
- the SQL Server instance you want to use for
...
- the repository database.
- Type the name for the
...
- SQLDM Repository
...
- Database.
...
- If your SQL Server environment uses SQL Server Authentication, select the respective check box and click Change to enter SQL Server credentials. By default,
...
- SQL Diagnostic Manager uses your Windows credentials when connecting to the Repository
...
- .
...
- If
...
- want the SQL Diagnostic Management Service to use SQL Server Authentication,
...
- select the respective
...
- check box and click Change to enter SQL Server credentials. By default, SQL Diagnostic Manager uses your Windows credentials when connecting to the Repository.

- Click Next.
| Tip |
|---|
SQL Diagnostic Manager 10.3 requires Microsoft SQL Server 2005 or above running on the computer that hosts the SQL Diagnostic Manager Repository database for all installations |
...
. |
Select a SQL Server instance to use for the
...
SQL Diagnostic Manager Index Database
The SQLDM SQL Diagnostic Manager Index Database is used to store stores information related to the various installations of SQL Diagnostic Manager that may be distributed in your environment. Note that the SQLDM Desktop Client should connect to the index database to manage the different installations of SQL Diagnostic Manager.
| Info |
|---|
Creating an Index Database is optional. Remember that it is only used when the Windows Client needs to simultaneously manage multiple DM installations (DMSO). |
To specify the SQL Server instance to install the index database on:
- On the SQL Diagnostic Manager Index Database screen, check the Use Index Database option. By default, SQL Diagnostic Manager does not create an index database.
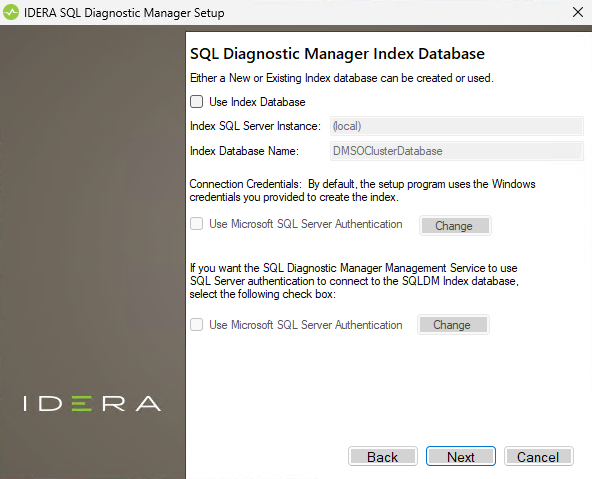
- Specify specify the SQL Server instance you want to use for the index database.
- Type the name for the index database.
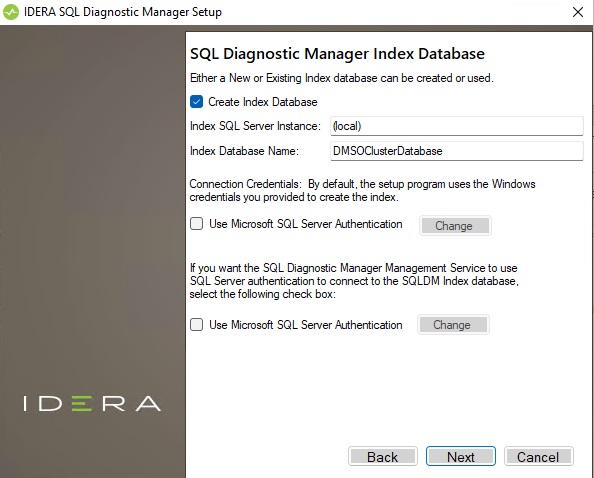
If your SQL Server environment uses SQL Server Authentication, select the respective check box and click Change to enter SQL Server credentials. By default, the IDERA Dashboard uses SQLDM Web Console uses your Windows credentials when connecting to the Repository database.
Info If you use Microsoft SQL Server Authentication, a new window displays where you can type the respective SQL Server login and password.
- Click Next.
Select
...
The SQL Diagnostic Manager Repository is where the collected data, alert information, and alert configuration settings are stored.
To specify the SQL Server instance to install the SQL Diagnostic Manager Repository on:
- On the SQL Diagnostic Manager Repository screen, specify the SQL Server instance you want to use for the repository database.
- Type the name for the SQLDM Repository Database.
- If your SQL Server environment uses SQL Server Authentication, select the respective check box and click Change to enter SQL Server credentials. By default, SQL Diagnostic Manager uses your Windows credentials when connecting to the Repository.
- If want the SQL Diagnostic Management Service to use SQL Server Authentication, select the respective check box and click Change to enter SQL Server credentials. By default, SQL Diagnostic Manager uses your Windows credentials when connecting to the Repository.
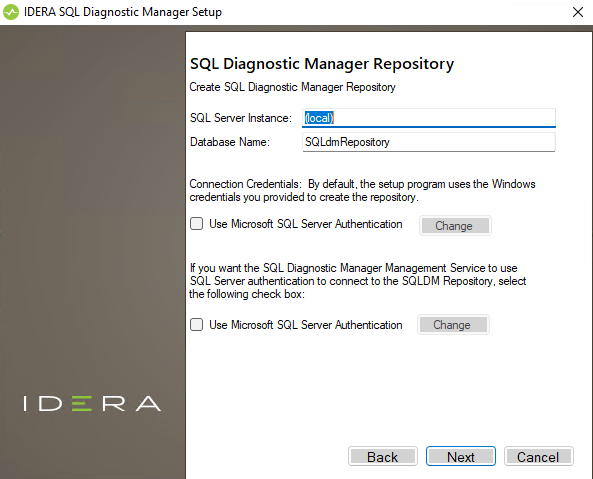
- Click Next.
| Tip |
|---|
SQL Diagnostic Manager 10.3 requires Microsoft SQL Server 2005 or above running on the computer that hosts the SQL Diagnostic Manager Repository database for all installations. |
...
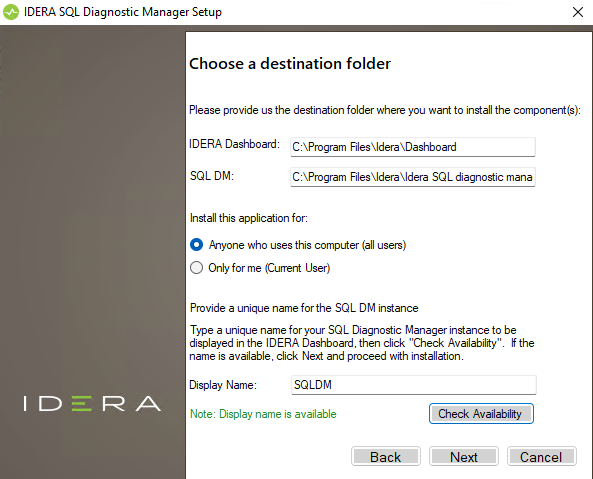
an installation location and type a display name for your instance
You can use the default install location or specify a different path. For your first installation, we recommend using the default location. On the Display Name text box, type a unique name for your SQLDM instance. The display name helps you to distinguish different instances of the same product. Click Next to continue with the installation.
...
| title | Display name |
|---|
...

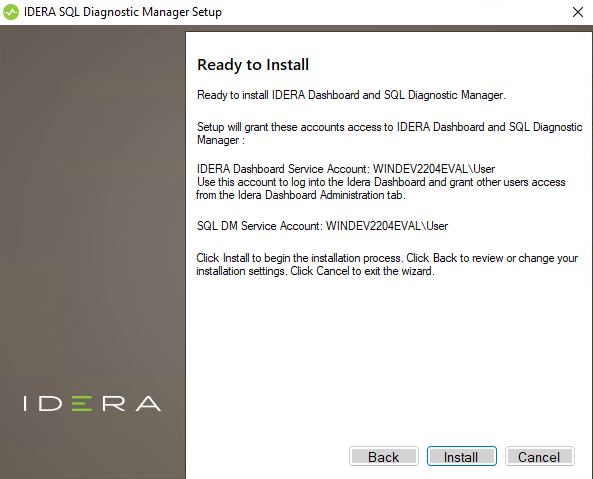
Complete the install
The setup will grant the provided accounts access to SQL Diagnostic Manager and the IDERA DashboardSQLDM Web Console. The user that installs the IDERA Dashboard SQLDM Web Console has access to this application by default as a Dashboard an Administrator. You can choose whether you want other users to have access to the IDERA Dashboard SQLDM Web Console in the Administration view.
- Click Install to indicate that you are ready to complete your installation with the configurations you specified. If you want to review or change any of your settings, click Back.

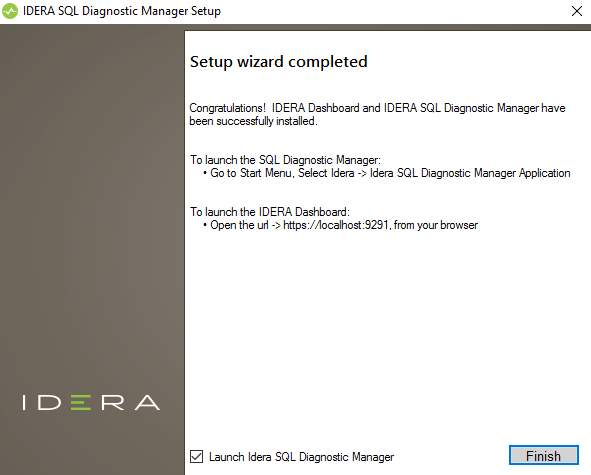
2. Click Finish to exit the IDERA Dashboard Setup SQL Diagnostic Manager Setup Wizard.
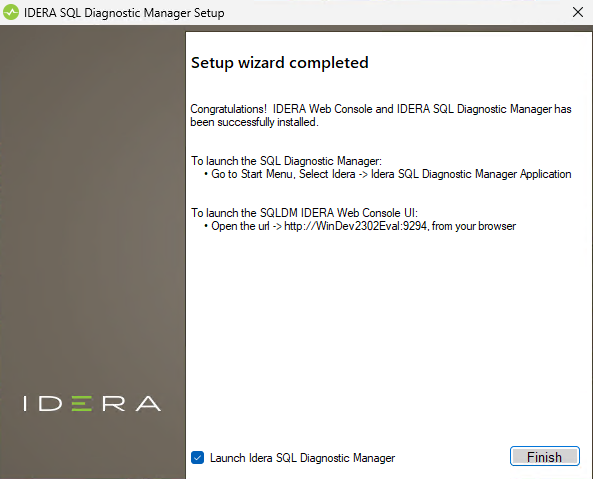
...
When you finish the installation, the Welcome window opens allowing you to Visit the IDERA Trial Center, Add New Servers (Recommended), Configure Default Alert Thresholds, or Start the Desktop Console.
...
To access the IDERA Dashboard and the SQL Diagnostic Manager web console, see Log in the IDERA Dashboard and web console.
| Warning | ||
|---|---|---|
| ||
If you wish to uninstall the IDERA Dashboard, make sure to unregister all products by clicking the Manage Products link of the Products widget in the Administration view. For additional information, see Managing products in the IDERA Dashboard. |
Decide whether you want to deploy SQLDM Mobile
...
| Info | ||
|---|---|---|
| ||
If you want to know how to access the SQLDM Web Console, visit the Log in to the SQLDM Web Console page. |