Page History
The Custom Dashboards tab of the SQL Diagnostic Manager web console allows you to create and view custom dashboards. You can define and save multiple dashboard views to compare metrics across your monitored SQL Server instances.
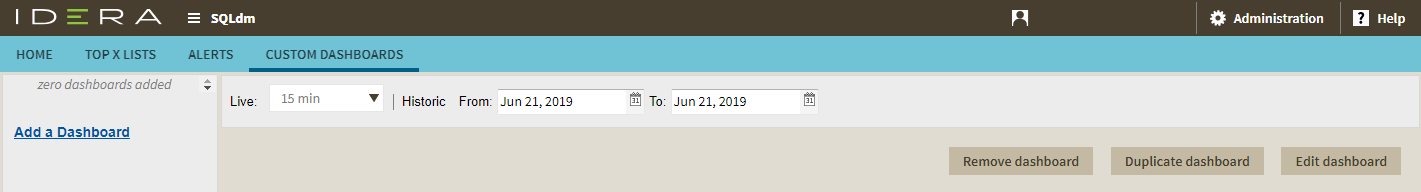
Add a dashboard
To add a dashboard:
- Click Add a Dashboard in the Custom Dashboards view.
- Type a dashboard name on the Add a Dashboard window.
- Select the Default check box, if you want to set this dashboard as the default one.
- Click Save.
Add widgets to your dashboard
Customize your dashboard by adding widgets to display specific SQL Diagnostic Manager metrics. You can add a widget at a time.
...
- Click Add a Widget in the Edit Dashboard view.
- Type a label for your widget in the corresponding box or leave it empty for default.
- Select a widget type.
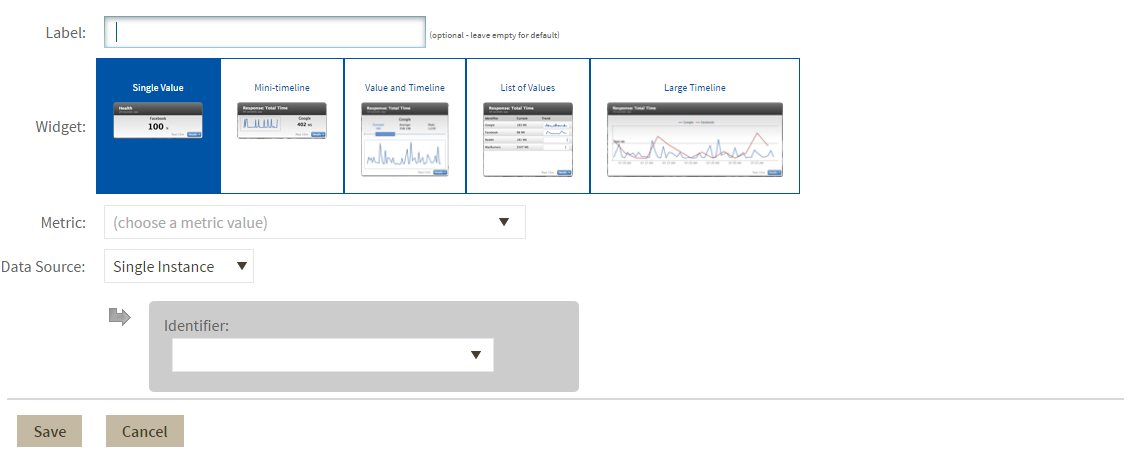
- Choose a metric from the drop-down list.
- Choose a data source from the drop-down list. Available options vary according to the type of widget selected and include:
- Single Instance
- Multiple Instance
- Tag Name
- All Instances
- Choose an identifier or identifiers from the drop-down list. Note that if you select the All Instances data source option, it is not possible to assign an identifier.
- Click Save.
Actions to perform in your Custom Dashboards View
The SQL Diagnostic Manager web console allows you to perform the following actions in your Custom Dashboards view:
...
| Tip |
|---|
To display a widget in full size, click Details. |
Filter results by time frame
Filter results in your dashboard by specific built-in periods from the Live list or by specific start and end dates in the historic timeframe option.
| Note |
|---|
| By default, the results of the timeframe is the current date. |
Edit your dashboard
In the Edit Dashboard view, you can:
- Change your dashboard name.
- Set your dashboard as the default one by selecting the Default check box.
- Select or create a dashboard tag by typing a name in the Dashboard Tags box.
- Add a new widget, remove, or edit current widgets.
- Place and order widgets in your dashboard by dragging and dropping them.
To access to the Edit Dashboard view, click Edit Dashboard in the Custom Dashboards view.
| Note |
|---|
Click Save after making changes in the Edit Dashboard view. |
Remove a dashboard
To remove a dashboard, click Remove Dashboard and then select OK on the Confirmation window.
Duplicate a dashboard
To duplicate a dashboard, click Duplicate Dashboard.