Page History
The History Browser is intended to provide information pertaining to the state of your SQL Server SQL Server instance at the time a standard snapshot is taken. You can use this information to diagnose and resolve issues to keep the issue from happening again. The History Browser allows you to select a historical snapshot collected by the standard refresh and view the data that was collected using almost all the SQL Diagnostic Manager real-time views.
| Info |
|---|
By default, Session details and inactive alerts are stored for 31 days while standard metric information is stored for 365 days. You can edit these options on the Grooming Options window. |
Access the History Browser
...
Historical Snapshot drop-down
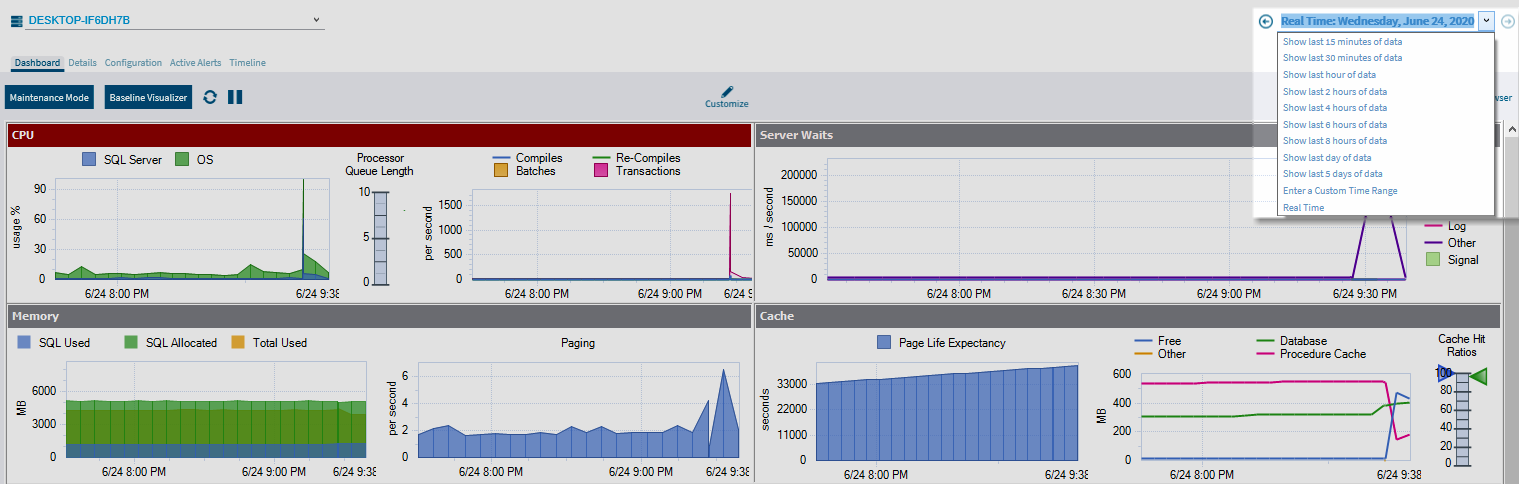
SQL Diagnostic Manager has a historical snapshot drop-down in the top-right corner, the drop-down allows you to retrieve faster historical and real time data. The following options are available for the data retrieval:
- Real Time
- Show last 15minutes of data
- Show last 30 minutes of data
- Show last hour of data
- Show last 2 hours of data
- Show last 4 hours of data
- Shot last 6 hours of data
- Show last day of data
- Show last 5 days of data
- Enter a Custom Time Range
Select a specific snapshot in time in the History Browser
...
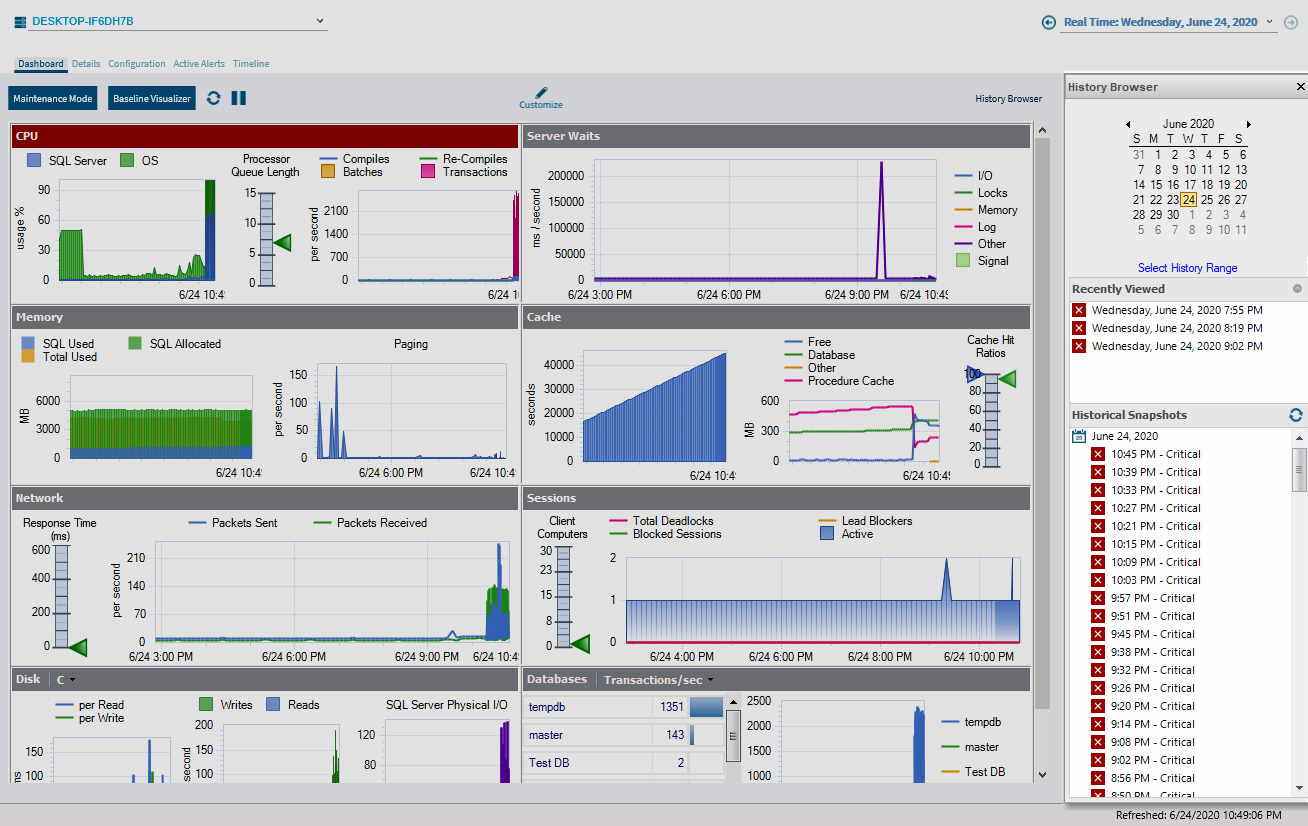
- Open the History Browser.
- Select the date from the calendar. You can also select the time range to filter the number of snapshots displayed.
- Select the corresponding snapshot from the Historical Snapshots list.
| Tip |
|---|
The icons next to each of the snapshots represent the highest level of alert thresholds violated. These icons can help you identify a specific snapshot. In addition, you can hover over snapshots in the list to see the most critical alerts associated with the snapshot. |
| Note |
|---|
The alert status listed by snapshots in the History Browser may not reflect the latest status due to delays in writing history to the repository. This status corrects eventually in the History Browser. |
Return to Real-Time mode
To return to Real-Time mode, either click the You are currently viewing a historical snapshot. Click here to switch to Real Time Mode text at the top of the window you are viewing historical data or click the associated text on a non-supported view.
Alerts with associated views that support historical snapshots
...
Alert | Associated View |
|---|---|
Average Disk Milliseconds Per Read | Resources |
Average Disk Milliseconds Per Transfer | Resources |
Average Disk Milliseconds Per Write | Resources |
Blocked Sessions (Count) | Sessions |
Blocking Session Wait Time (Seconds) | Sessions |
Client Computers (Count) | Sessions |
Databases Read/Write Errors Occurred | Databases |
Disk Reads Per Second | Resources |
Disk Transfers Per Second | Resources |
Disk Writes Per Second | Resources |
Host CPU Usage CPU Usage (Percent) | Resources |
Host Memory Usage (Percent) | Resources |
Oldest Open Transactions (Minutes) | Sessions |
OS Average OS Average Disk Queue Length (Count) | Resources |
OS Average OS Average Disk Queue Length Per Disk (Count) | Resources |
OS Disk OS Disk Time (Percent) | Resources |
OS Disk OS Disk Time Per Disk (Percent) | Resources |
OS Memory OS Memory Usage (Percent) | Resources |
OS Paging OS Paging (Per Second) | Resources |
OS Privileged OS Privileged Time (Percent) | Resources |
OS Processor OS Processor Queue Length (Count) | Resources |
OS Processor OS Processor Time (Percent) | Resources |
Page Life Expectancy | Server |
Session CPU Time CPU Time (Seconds) | Sessions |
SQL Server SQL Server CPU Usage (Percent) | Resources |
SQL Server SQL Server Memory Usage (Percent) | Resources |
SQL Server SQL Server Response Time (Milliseconds) | Sessions |
Tempdb Contention (ms) | Databases |
User Connections (Percent) | Sessions |
VM CPU Usage VM CPU Usage (Percent) | Resources |
VM Memory Usage (Percent) | Resources |
Views that support historical snapshots
Users may notify you of SQL Server SQL Server problems that have happened in the past. Using the History Browser, you can go back to a point in time and view the state of your system and also compare system states at different points in time.
...
- Overview > Dashboard
- Overview > Details> Details
- Overview > Active Alerts
- Sessions > Summary
- Sessions > Details
- Sessions > Locks
- Sessions > Blocking
- Queries > Signature Mode
- Queries > Statement Mode
- Queries > Query > Query History
- Queries > Query Waits
- Resources > Summary
- Resources > CPU> CPU
- Resources > Memory
- Resources > Disk
- Resources > File Activity
- Resources > Server Waits
- Databases > Tempdb Summary
- Databases > Availability Group
- Analyze > History
...