Page History
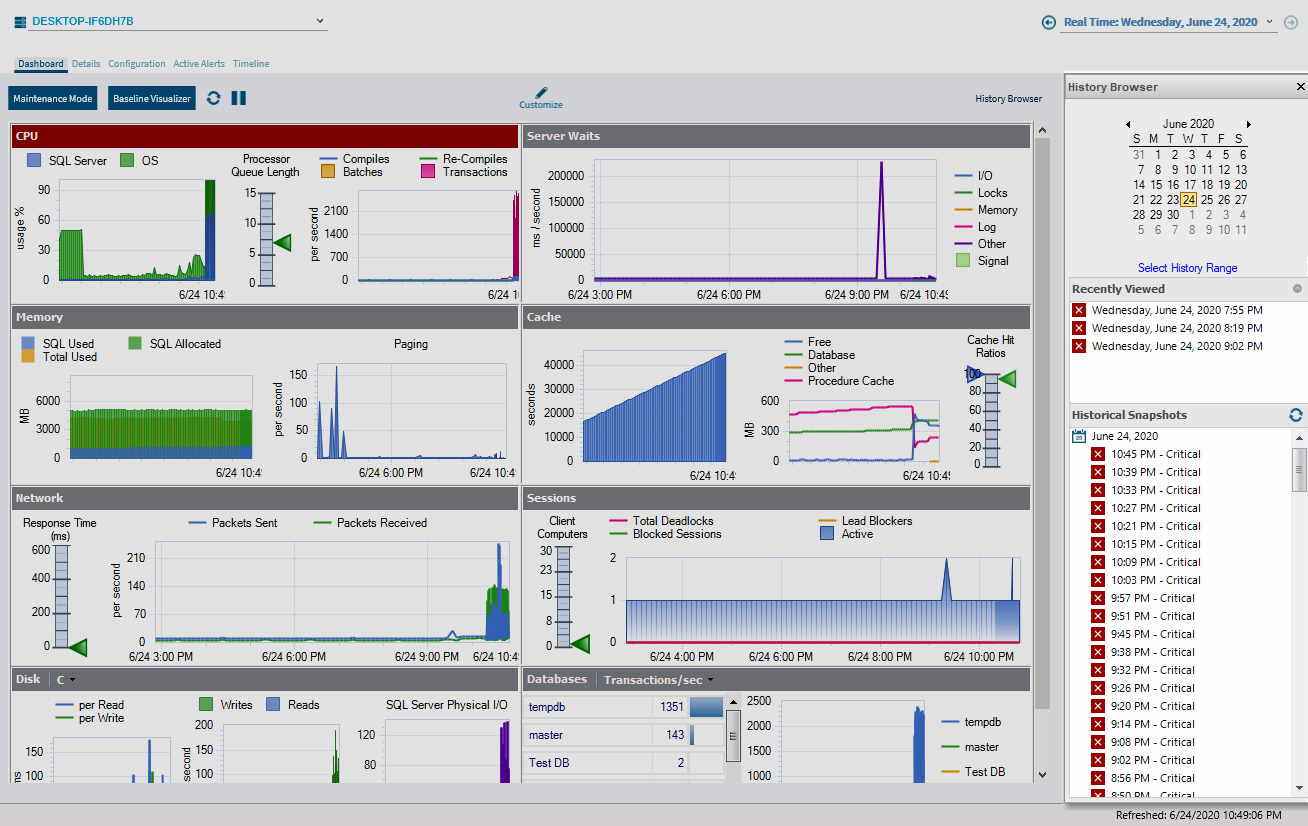
The History Browser is intended to provide information pertaining to about the state of your SQL Server instance at the time a standard snapshot is taken. You can use this information to diagnose and resolve issues to keep the issue from happening again. The History Browser allows you to select a historical snapshot collected by the standard refresh and view the data that was collected using almost all the SQL Diagnostic Manager real-time views.
...
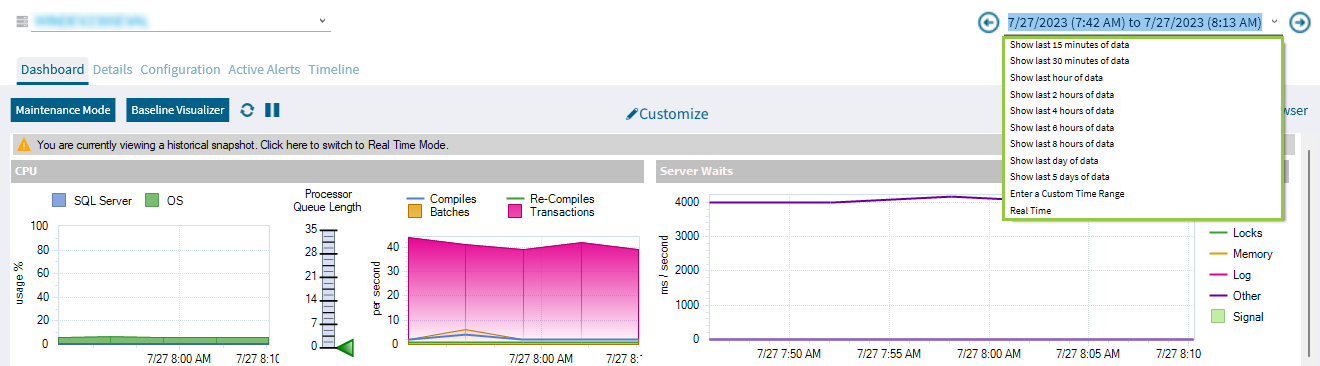
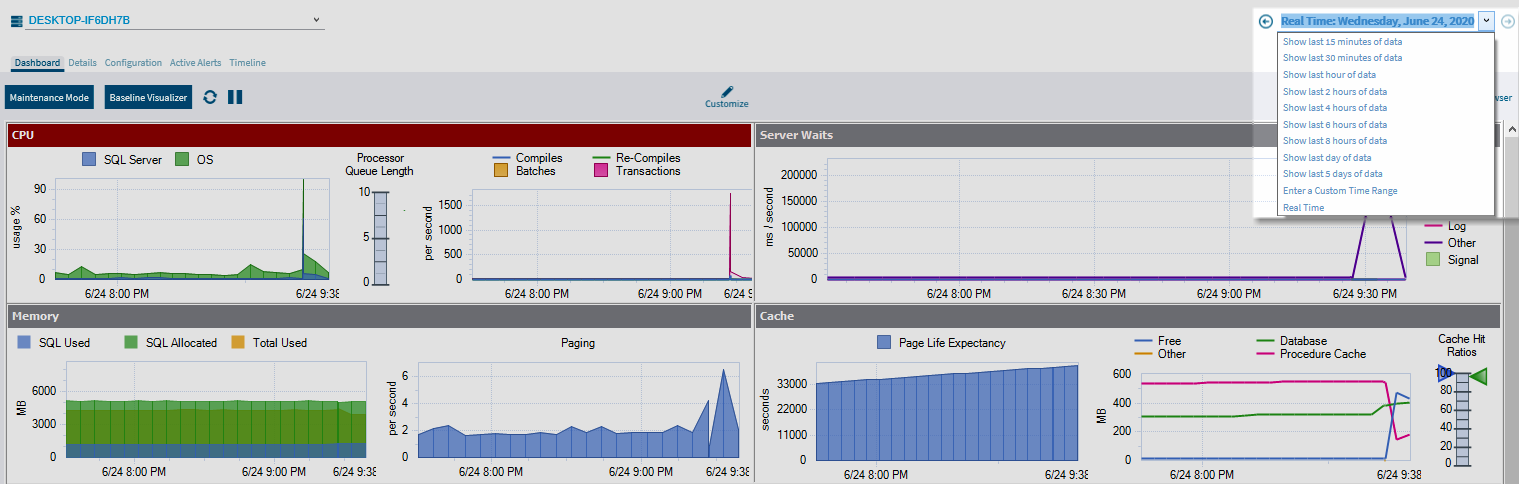
SQL Diagnostic Manager has a historical snapshot drop-down in the top-right corner, the drop-down allows you to retrieve faster historical and real-time data. The following options are available for the data retrieval:
- Real Time
- Show last 15minutes 15 minutes of data
- Show last 30 minutes of data
- Show last hour of data
- Show last 2 hours of data
- Show last 4 hours of data
- Shot last 6 hours of data
- Show last day of data
- Show last 5 days of data
- Enter a Custom Time Range
Select a specific snapshot in time in the History Browser
...
- Open the History Browser.
- Select the date from the calendar. You can also select the time range to filter the number of snapshots displayed.
- Select the corresponding snapshot from the Historical Snapshots list.
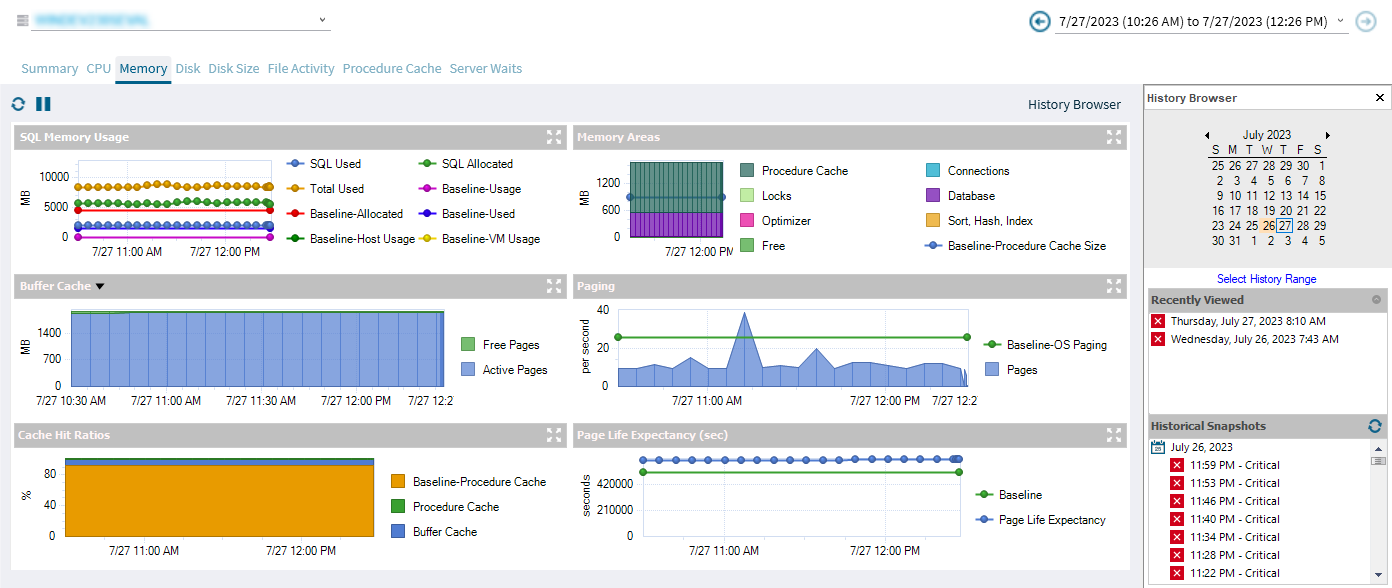
| Tip |
|---|
The icons next to each of the snapshots snapshot represent the highest level of alert thresholds violated. These icons can help you identify a specific snapshot. In addition, you can hover over snapshots in the list to see the most critical alerts associated with the snapshot. |
...
On the Alerts view, some of the alerts allows allow you to retrieve the associated view at the time when the alert was is activated. To access this view, right-click the alerts, alert and the click Show Historical View in the Details pane.
...