Page History
...
The list sub-view offers a means to quickly identify the status of instances, as well as the possibility to navigate to the single instance dashboard when clicking on a specific row.


The list sub-view provides you with the following SQL Server information:
SWA
Displays the SWA icon when the instance is registered in SQL Workload Analysis.
Health
Displays the health index in percentage in a red square.
CPU, Memory, I/O, Database, Logs, and Queries
Displays the overall health index icon for each option.
Instance Name
Displays the name of the monitored SQL Server instance.
...
Instances on the list sub-view are sorted by severity. To re-organize information, click a column header or select the option to group by severity, tags, or tagsSQLdmRepo (Group By).
Search Instance
Type the name of the instance you are looking for.
Options
Choose the columns to display in the list view.
Export
You can export instance information in PDF, XLS, or XML by clicking EXPORT at the top of the list sub-view.
...
In addition, the thumbnail sub-view includes CPU, Memory, I/O, and Response Time sparkline graphs for a 1 hour-view so that users can obtain an overview of key metrics quickly.

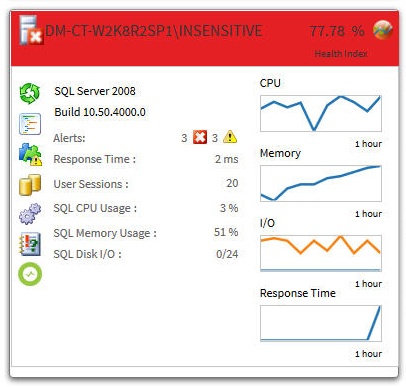
Category icons and actions
In the thumbnail sub-view, use your mouse cursor to hover on a category icon in the left of the thumbnail. If the category icon contains active alerts, you can click it to access the Alerts Detail screen. ![]()
If there are no active alerts, you can click a category icon and you are directed to a specific category view in the single instance dashboard. The table below shows the relationship between the category icons and their corresponding views:
| Icon | Category |
|---|---|
 | Sessions tab of the single instance dashboard |
 | Queries tab of the single instance dashboard |
 | Resources tab of the single instance dashboard |
 | Databases tab of the single instance dashboard |
 | Alerts Detail screen |
| Overview tab of the single instance dashboard | |
| Launch SWA |
| Info |
|---|
Instances in thumbnail sub-view display according to severity. This means that critical instances show up on the top of the dashboard. |
...
Upon clicking a specific square, the health index displays performance line charts for CPU, Memory, IO, and Response Time from the past hour.
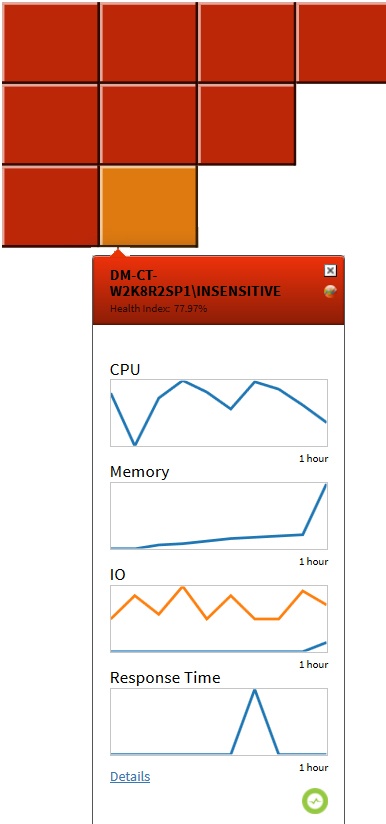

Additionally, you can:
- Click Details to access the Overview tab of the single instance dashboard.
- Launch the SQL Diagnostic Manager console by clicking the SQL Diagnostic Manager icon
 .
. - Launch SQL Workload Analysis by clicking the SWA icon
 .
.
How to interpret the health index in the heatmap sub-view?
...
| Scroll pdf ignore |
|---|
SQL Diagnostic Manager identifies and resolves SQL Server performance problems before they happen. Learn more > > |