Page History
The Sessions tab of the single instance dashboard allows you to quickly view key diagnostic statistics for sessions on your SQL Server instance and contains the Overview and Session Graphs views. Click image to view full size.
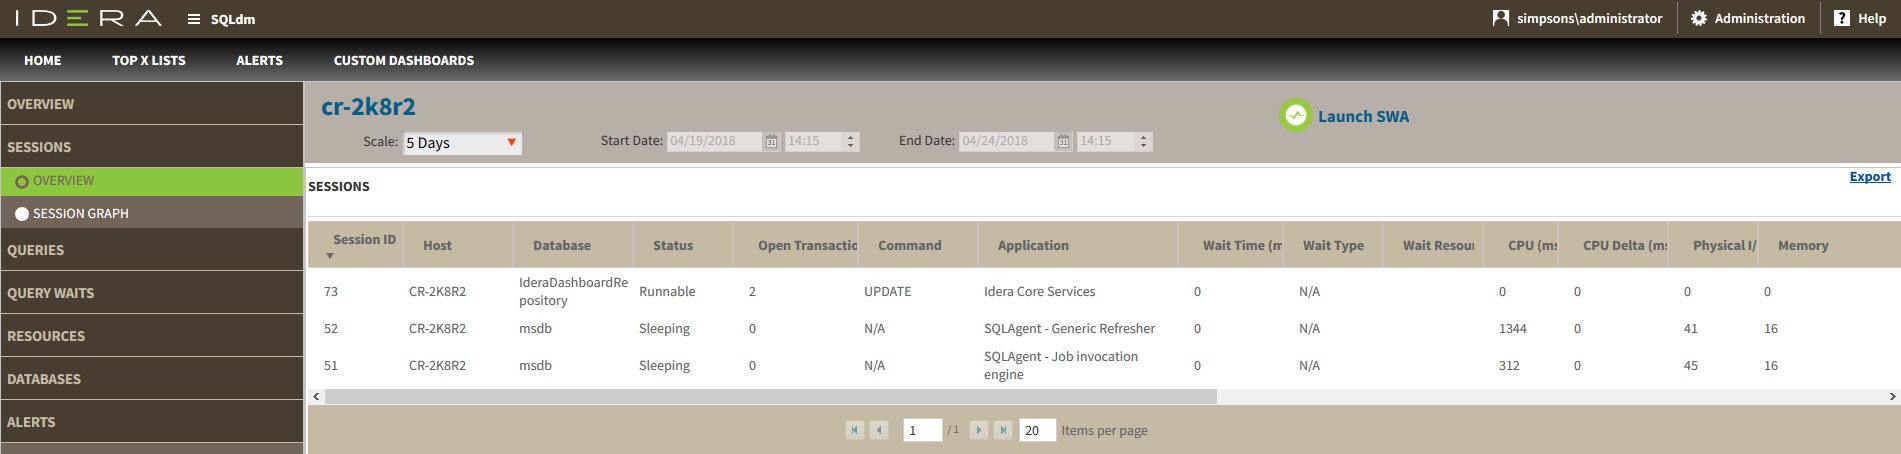

Overview
The Sessions > Overview tab contains the following information:
...
The Sessions > Sessions Graphs tab contains the following charts (Click image to view full size):
Response Time (ms)
The Response Time chart displays the response time (in milliseconds) it takes a Select SQL statement to go to the SQL Server instance and back. This chart indicates the current speed and congestion of the network as well as the speed with which SQL Server processes small queries.
...