Page History
...
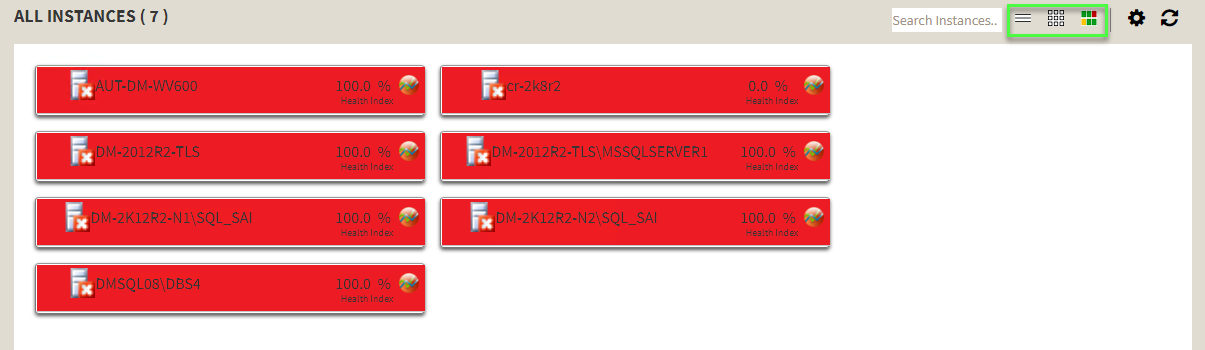
These sub-views display all data collected at the last refresh for all your monitored SQL Server instances. To access any sub-view, click the appropriate button in the upper-right corner of the dashboard as shown in the following image:

Anchor List List
List sub-view
| List | |
| List |
The list sub-view offers a means to quickly identify the status of instances, as well as the possibility to navigate to the single instance dashboard when clicking on a specific row.
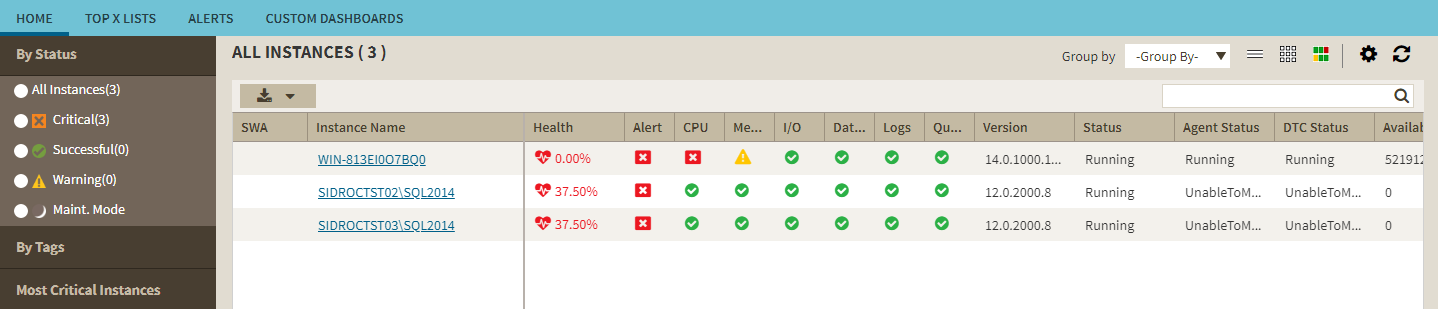

The list sub-view provides you with the following SQL Server information:
...
Displays the SWA icon when the instance is registered in SQL Workload Analysis.
Instance Name
Displays the name of the monitored SQL Server instance.
Health
Displays the health index in percentage in a red square.
Alert
Displays the current severity of the value of the instance.
CPU, Memory, I/O, Database, Logs, and Queries
Displays the overall health index icon for each option.
Instance Name
Displays the name of the monitored SQL Server instance.
SQL Server Version
Displays the edition and version of SQL Server software used in this instance.
...
Instances on the list sub-view are sorted by severity. To re-organize information, click a column header or select the option to group by severity, tags, or SQLdmRepo (Group By).
Search Instance
Type the name of the instance you are looking for.
Options
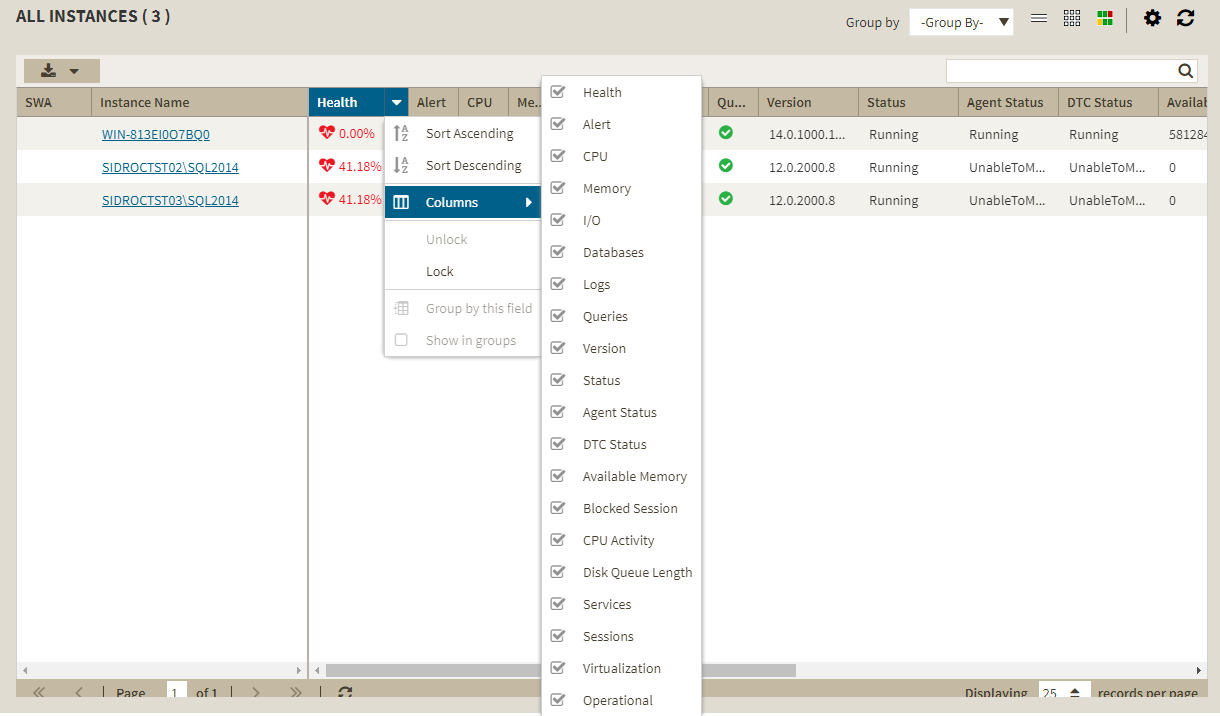
Choose the columns to display in the list view.
Export
You can export instance information in PDF, XLS, or XML by clicking EXPORT at the top of the list sub-view.
...
The Dashboard console has a new alert grid and custom filters that help you organize the list columns in your most convenient way. Click the ![]() icon located next to the column name to expand the drop down menu. This menu allows you to sort your criteria by Sort Ascending or Sort Descending, you can remove or add columns, lock and unlock, and group the information by fields.
icon located next to the column name to expand the drop down menu. This menu allows you to sort your criteria by Sort Ascending or Sort Descending, you can remove or add columns, lock and unlock, and group the information by fields.
...
You can hide/show instances information by clicking HIDE INSTANCES at the top of the list sub-view.
Anchor thumbnail thumbnail
Thumbnail sub-view
| thumbnail | |
| thumbnail |
...
How to interpret the health index in the heatmap heat map sub-view?
The health index is a percentage value that provides an estimate of the relative health of your monitored SQL Server. The health index is based on the following raw calculation:
...
The raw score is normalized to a range between 100% and 0%. SQL Server is healthier the closer its health index is to 100%, and it is in critical state the closer its health index is to 0%. Use the severity factors to change the relative weight in the calculation. Use tag and instance factors to assign instances more or less importance in the overall heatmap heat map ranking.
Anchor heatmapconfig heatmapconfig
To configure the Health Index Calculations:
| heatmapconfig | |
| heatmapconfig |
...