Page History
...
| Tip |
|---|
Assign a friendly name to your instance that is meaningful to you and easy to identify. |
SQL Version
Indicates the current SQL Server version including service pack and build information on this SQL Server instance.
...
The single instance dashboard includes the following charts:
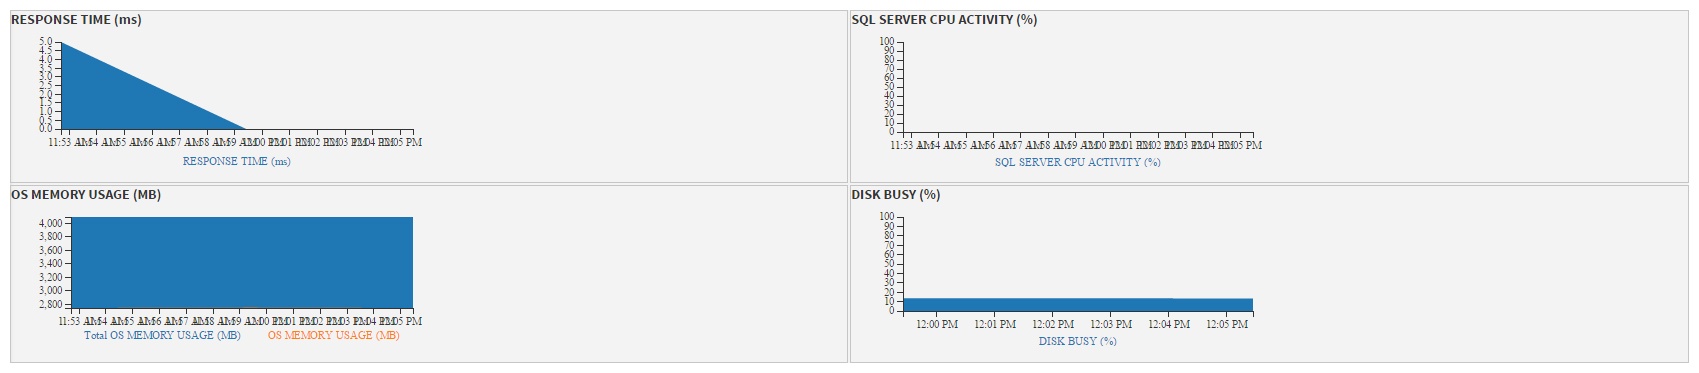
Response Time
The Response Time chart displays the response time (in milliseconds) it takes a Select SQL statement to go to the SQL Server instance and back. This chart indicates the current speed and congestion of the network as well as the speed with which SQL Server processes small queries. To obtain additional key diagnostic statistics for sessions on your SQL Server instance, click the chart and you’re directed to the Sessions > Overview view. This view contains various charts like the Response Time (ms), Session Activity, and Blocked Sessions.
...
The single instance dashboard contains the Sessions, Queries, Query Waits, Resources, Databases, and Alerts tabs where you can see metrics and information on these category views.
![]()
From these tabs you can:
- View your SQL Server sessions information.
- View your SQL Server queries information.
- View your SQL Server query waits information.
- View your SQL Server resources information.
- View your SQL Server databases information.
- View your SQL Server alerts.
Access the single instance dashboard
...
| Scroll pdf ignore |
|---|
SQL Diagnostic Manager identifies and resolves SQL Server performance problems before they happen. Learn more > > |