Page History
The profiling interface is divided into three major parts: Load graph, Top Activity, and Profiling Details view.
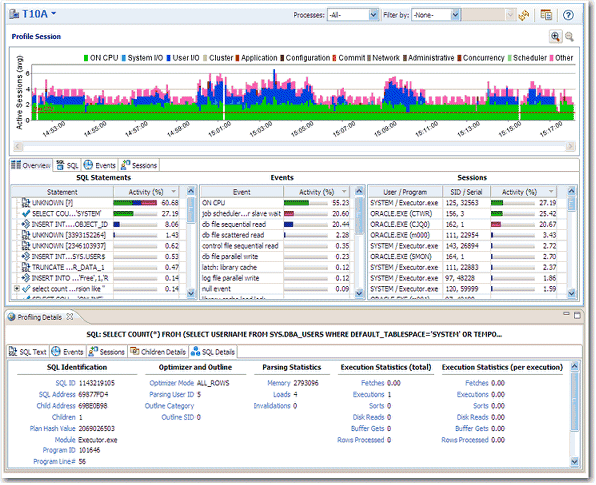
- The Load Graph is located on the top section of the editor and provides a display of the overall load on the system. The bars represent individual aspects of the enterprise, and the view can be used to find bottlenecks.
- Top Activity is located on the middle section of the editor and displays where the load originates. Specifically, the top SQL statements, top events that the database spends time in, as well as the top activity sessions.
- The Profiling Details View is located on the bottom section of the editor and displays detailed information on any item selected in the middle section. For example, an SQL statement, an Event, or a Session.
...