Page History
...
This section is comprised of the following topics: •
...
| Anchor | ||||
|---|---|---|---|---|
|
This section is comprised of the following topics:
- Choosing the Tuning Statement and Generated Case to Analyze
- Viewing the VST Diagram Legend
- Viewing Table Counts and Ratios
- Viewing the Explain Plan
- Viewing the VST Diagram in Summary Mode
- Viewing the VST Diagram in Detail Mode
- Changing Detail Level for a Specific Table
- Viewing All Table Fields
- Viewing Diagram Object SQL
- Expanding Views in the VST Diagram
- Viewing the Oracle Explain Plan Overlay
Choosing the Tuning Statement and Generated Case to Analyze
If, from the Overview tab, you have run the tuning job using more than one tuning statement, from the Analysis tab, you can choose to see the SQL analysis of any one of the tuning statements.
- On the Analysis tab, click the Select statement of interest list and choose the tuning statement you want to see analyzed here.
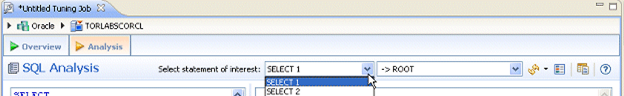
Notice that next to the statement of interest box another list ->ROOT. This shows that the statement being analyzed is the original statement, without any of the generated cases. This is the default selection. - To choose the generated case to be analyzed, click the second Select statement of interest list and choose a generated case.
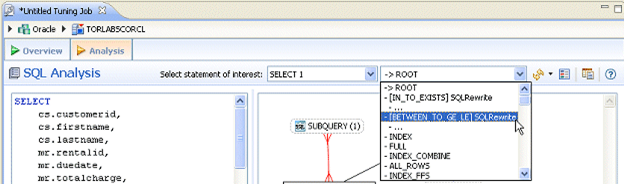
After you make your selections, a new analysis is performed taking into consideration the statement and case you chose. A new diagram is displayed and the Index Analysis, Table Statistics, Column Statistics And Histograms, and Outlines are recalculated and updated.
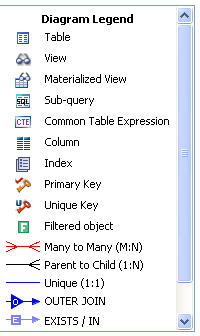
Viewing the VST Diagram Legend
Click the Diagram Legend toggle [![]() ] to view the legend and then click it again to hide it. All the icons used in the VST diagram are identified and in the Diagram Legend.
] to view the legend and then click it again to hide it. All the icons used in the VST diagram are identified and in the Diagram Legend.
Viewing Table Counts and Ratios
To view or hide table counts, two table join sizes and filtered result set ratios, click the Ratios and Counts icon [![]() ].
].
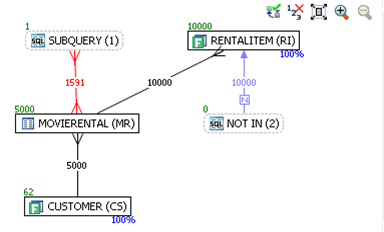
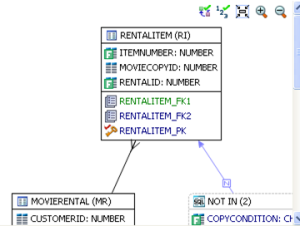
Green numbers at top left of table represent the total number of rows in that table. In the above the MOVIERENTAL (MR) table has 5000 rows.
Blue percentage at the bottom right of the table represent the percentage of rows in that table that meet the selection criteria. In the above example, 100 percent of the rows in the RENTALITEM (RI) table have met the selection criteria.
The numbers on the table joins indicate the total number of rows that meet the selection criteria for both tables.
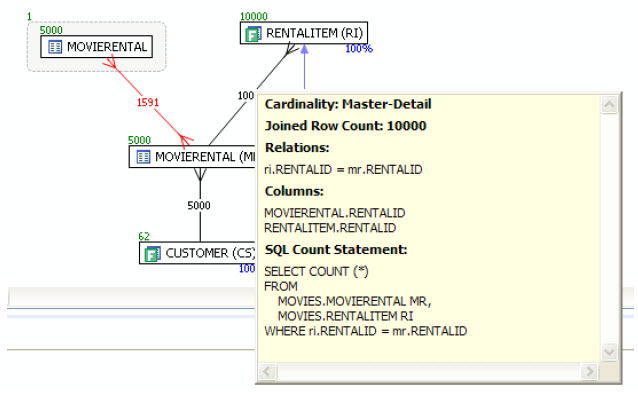
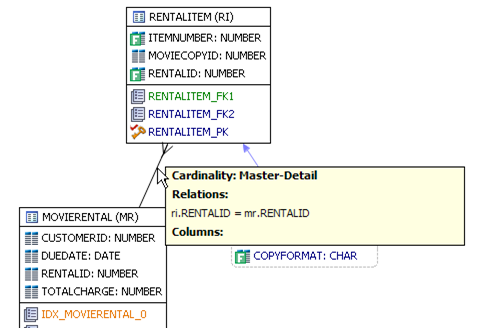
You can also view the SQL Query that created a relationship by hovering over the relationship. If the tool tip content is larger than the size of the tool tip rectangle, you can hover the mouse on top of the tooltip for a second, and then it will turn into a dialog you can re-size, scroll in, and select text from to copy into the Clipboard.
Viewing the VST Diagram in Summary Mode
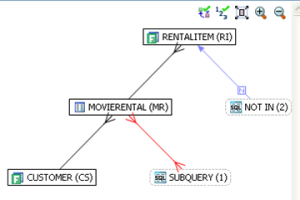
By default the diagram displays Summary Mode, showing only table names and joins, as seen in the following illustration
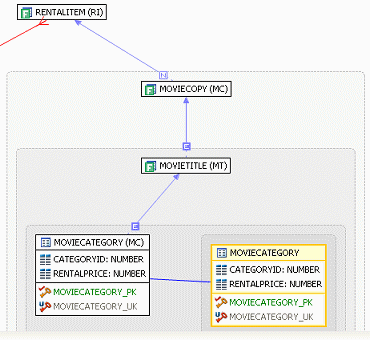
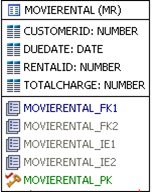
Viewing the VST Diagram in Detail Mode
By default, the VST diagram displays in Summary Mode, but by clicking the Detail Mode/Summary Mode switch.
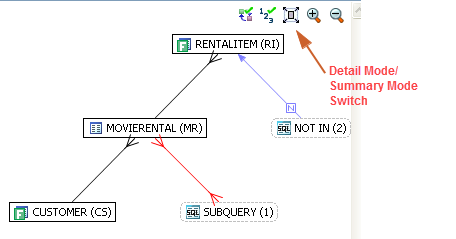
Additional details of the tables display, including table columns and indexes
Changing Detail Level for a Specific Table
You can also switch between Summary Mode and Detail Mode for a specific table or view, by double-clicking the object name.
Viewing All Table Fields
By default, only fields that are used in the WHERE clause are displayed in detail mode; however, if you right-click the table you can choose to display even unused columns as follows:
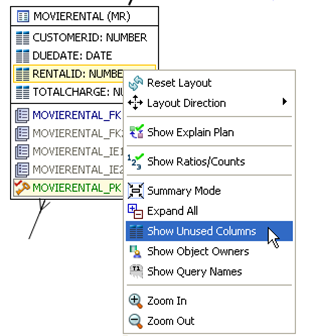
All the columns in the table are shown, and not just the ones used in the WHERE clause of the SQL statement.
Viewing Diagram
...
Object SQL
While in Detail Mode, hovering the mouse over the sub query, table name, field, or index displays the SQL required to create that object.
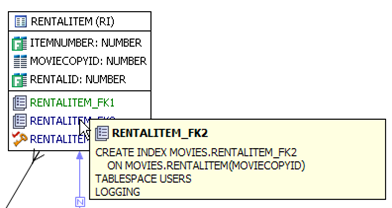
Hovering over the join between two tables displays the relationship between the two tables.
Expanding Views in the VST Diagram
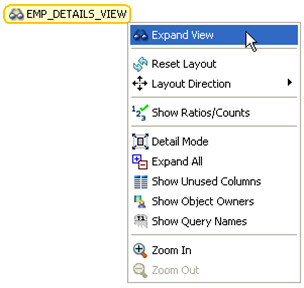
If there are views in the Visual SQL Tuning diagram, they can be expanded by right clicking the view name and choosing Expand View.
Right click on the view, and choose Expand View.
Now we can see the objects in the view:
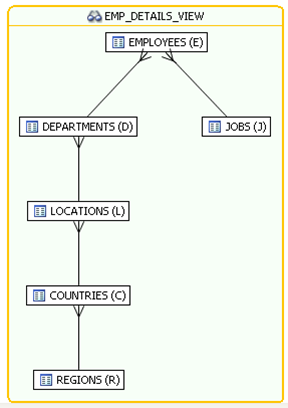
You can further expand the sub-view within the original view also.
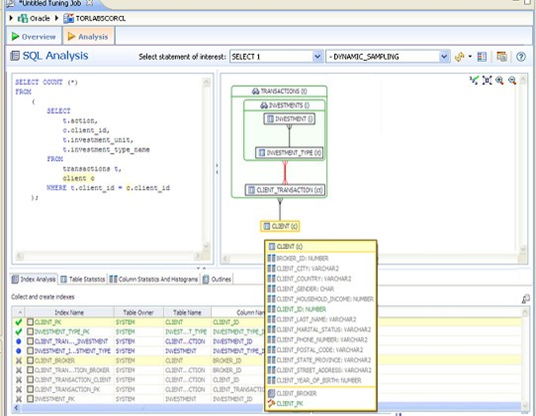
The following is an example of view expansion along with the Explain Plan to the left.
Notice in the view expansion a list of all the indexes on all the underlying tables in the views and sub views and which of those indexes is used in the default execution plan.
Viewing the Oracle Explain Plan Overlay
| Info |
|---|
This option is only available for Oracle versions 10 and higher. |
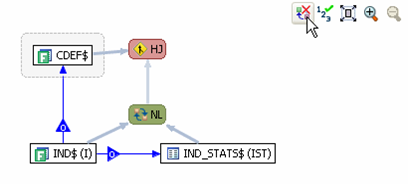
Click the Explain Plan toggle [![]() ], you can choose to view or hide the Explain Plan details. The additional nodes shown in the Explain Plan overlay provide details on the flow of the query plan, with operations (such as nested loops, sorts, and joins) showing connecting tables and other operations. Hover the mouse over the objects or relationships to view additional details.
], you can choose to view or hide the Explain Plan details. The additional nodes shown in the Explain Plan overlay provide details on the flow of the query plan, with operations (such as nested loops, sorts, and joins) showing connecting tables and other operations. Hover the mouse over the objects or relationships to view additional details.
Expanding Subqueries and Nested Subqueries
Double-click queries to expand them or right-click the query and select Expand Query from the menu that appears. The following shows several layers of nesting queries.