Page History
...
When a Procedure is selected, the following Profile Detail tabs are available.
| Tab Name | Description | Supported Platform | |||
|---|---|---|---|---|---|
| Oracle | Sybase | DB2 | SQL Server | ||
| SQL Text | Shows the SQL text of the selected procedure. | No | Yes | No | Yes |
| SQL | Shows which SQL statements this procedure ran. | No | Yes | No | Yes |
| Events | Shows which events the selected procedure waited on. | No | Yes | No | Yes |
| Sessions | Provides parameters regarding the session. For example, database server connection information, and data regarding the client tool and application. | No | Yes | No | Yes |
This section also addresses the following topics:
...
The SQL Details tab provides information and the execution of the statement and other information related to how it is running. It is only applicable to Oracle data sources:
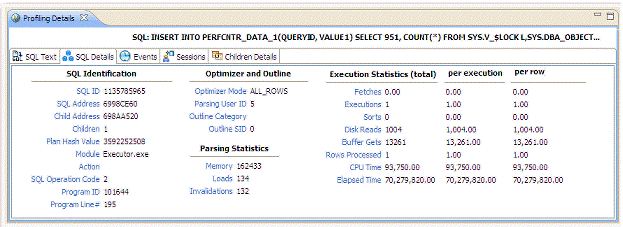
SQL Details include:
| Parameters | Description |
|---|---|
| SQL Identification Values | The SQL ID value of the statement. |
| Optimizer and Outline Values | Optimizer-specific values pertaining to the parsing user ID value and outline SID. |
| Parsing Statistics | Information regarding memory, loads, and invalidation values. |
| Execution Statistics | The execution statistics of the statement. This category includes disk reads, buffer gets, rows, and values that represent CPU and elapsed time. |
| Anchor | ||||
|---|---|---|---|---|
|
The Events tab provides details about the events that the statement is associated with.
...
The following parameters are displayed on the Procedures tab:
| Value | Description |
|---|---|
| Procedure Name | The name of the procedure that contains the selected statement. |
| Database Name | The name of the database where the procedure resides. |
| Procedure ID | The unique ID value of the file where the specified procedure resides. |
| Executions | The number of times the procedure was executed. |
| DB Activity (%) | Use the color chart on the right-hand side of the Procedures tab to view the procedures load on the data source during the profiling session. |
| Anchor | ||||
|---|---|---|---|---|
|
...
- Session Details tab: Shows system details about the selected session. For more information, see Session Details.
- SQL tab: Displays information about the SQL files that the selected session is associated with. This tab only appears on Oracle platforms. For more information, see SQL.
- Events tab: Displays the time and parameter information about the selected session. For more information, see Events.
- Procedures tab: Displays the details of any procedures run in the selected session. For SQL Server and Sybase data sources only. For more information, see Procedures.
Anchor sessiondetails sessiondetails
Session DetailsSession Details
| sessiondetails | |
| sessiondetails |
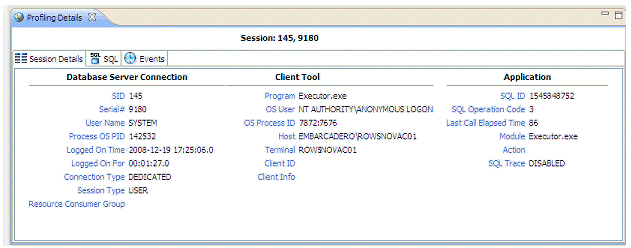
The Session tab provides further information about the selected session. The following are examples of the session details provided for different platforms.
| Info |
|---|
The fields that display vary depending on the database platform. |
Oracle Profiling Oracle Profiling Details
...
Microsoft SQL Server

| Anchor | ||||
|---|---|---|---|---|
|
The SQL tab displays information about the statements associated with the session.
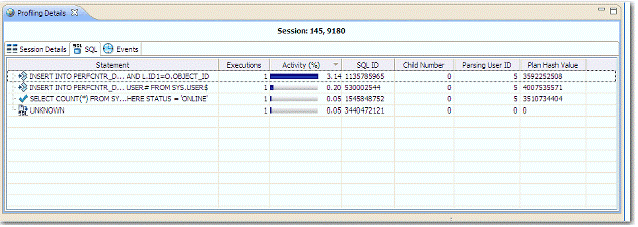
SQL statements are listed by the following parameters:
| Value | Notes |
|---|---|
| Statement |
...
| The name of the statement. |
...
| Executions | The number of times the statement was executed during the session. |
| Activity (%) | A graphical representation of the distribution of execution and wait time |
...
| for the statement or statement component. |
| SQL |
...
| ID | The SQL ID value of the statement. |
| Child |
...
| Number | The child number in the database. |
| Parsing User |
...
| ID | The ID of the user who parsed the statement. Plan Hash ValueThe execution value of the statement. |
| Plan Hash Value | The execution value of the statement. |
| Anchor | ||||
|---|---|---|---|---|
|
The Events tab provides details about the events that the session is associated with.
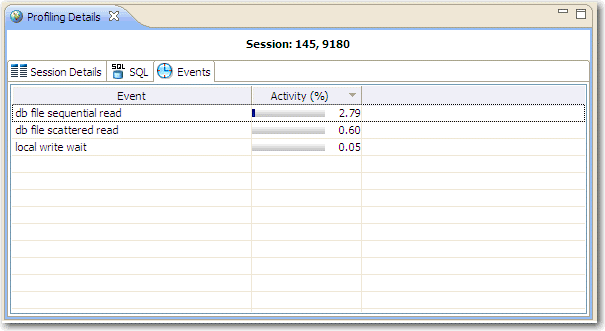
Events are listed by the following values:
| Value | Notes |
|---|---|
| Event |
...
| Name | The name of the event. |
| Activity (%) | A graphical representation of the distribution of execution and wait time for the statement or statement component. |
| Anchor | ||||
|---|---|---|---|---|
|
For SQL Server and Sybase data sources only, the Procedures tab provides details about the procedures that the session is associated with

The following parameters are displayed on the Procedures tab:
| Value | Description |
|---|---|
| Procedure |
...
| Name | The name of the procedure that ran during the selected session. |
| Database |
...
| Name | The name of the database where the procedure resides. |
| Procedure |
...
| ID | The unique ID value of the file where the specified procedure resides. |
...
| Executions | The number of times the procedure was executed during the session. |
| DB Activity (%) | Use the color chart on the right-hand side of the Procedures tab to view the procedures load on the data source during the profiling session. |
...
Bind Variable Details
For Oracle data sources, profiling captures the bind variables and their attributes. Select an SQL statement in the Profiling Session and the details of the captured bind variables for that statement are displayed here.
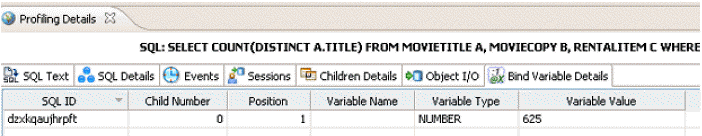
The following parameters are displayed on the Bind Variable Details tab:
| Value | Description |
|---|---|
| SQL |
...
| ID | SQL identifier used by the data source. |
| Child Number | A new child number is generated for the SQL ID of the query whenever the plan changes, for example the value of a bind variable is changed, and the query is executed again. |
| Position |
...
| The position of the variable within the SQL text. For example, given the query, select * from T1 where C1 = :a and C2 = :b and C3 = :c and C4 = :d, the position of a is 1, b is 2, c is 3 and d is 4. |
| Variable |
...
| Name | The name of the variable. |
| Variable |
...
| Type | The data type of the variable. |
| Variable |
...
| Value | The value of the variable. |
| Anchor | ||||
|---|---|---|---|---|
|
...
Viewing Details on the Blockers Tab (Oracle)
In the Top Activities Section, selecting an entry on the Blocked Sessions tab displays information on sessions holding blocking locks in the Profiling Details view.
Blocked Sessions
The Blocked Sessions tab provides general information on blocked sessions and the details identifying the specific row locked.
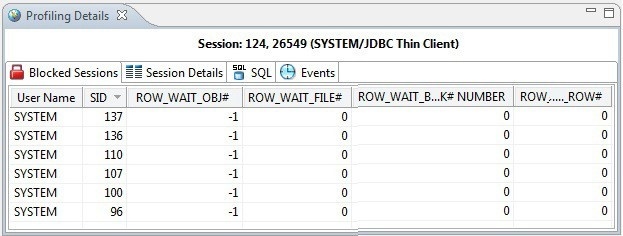
This tab provides the following columns for each blocked session:
Value | Notes |
|---|---|
User Name | The user name under which the blocking session was run. |
SID | The SID value of the blocking session. |
ROW_WAIT_OBJ# | Object ID of the table containing the row specified in ROW_WAIT_ROW#. |
ROW_WAIT_FILE# | Identifier of the datafile containing the row specified in |
ROW_WAIT_BLOCK# | Identifier of the block containing the row specified in ROW_WAIT_ROW#. |
ROW_WAIT_ROW# | The current row being locked. |
Session Details
The Session Details tab provides information on the server connection, client, and application associated with the blocking session.
SQL
The SQL tab displays information about the statements associated with the blocking session.
SQL statements are listed by the following parameters:
Value Notes
StatementThe name of the statement.
ExecutionsThe number of times the statement was executed during the session. Activity (%)A graphical representation of the distribution of execution and wait time
for the statement or statement component. SQL IDThe SQL ID value of the statement.
Child NumberThe child number in the database.
Events
The Events tab provides details about the events that the blocking session is associated with.
Events are listed by the following values:
Value Notes
EventThe name of the event.
DB Activity (%)A graphical representation of the distribution of execution and wait time for the statement or statement component.
...