Page History
...
The Activity tab was designed to answer questions such as, "What happened yesterday, as well as a month ago and a year ago?" and "What has been the performance level of my applications over time.".
Data in the Activity tab is available up to the last time slice that ended (information on the last minute is available in the Current tab). The Activity tab is usually the place to identify and investigate tuning problems.
When working in the Activity tab, you can choose to work on a specific entity or to view information on all the databases in the application.
| Info |
|---|
...
You usually switch to the Activity tab, after focusing on a database partition in the Dashboard tab, or by launching Precise for DB2 from another product (Insight, Alerts, or Report Manager). In these cases, the product automatically focuses on the relevant database partition. |
When you do not select a specific database partition to view in-context, a summary of the performance information on All database partitions in the application is displayed. You can analyze the average behavior of the entire Precise for DB2 Tier. You can then identify the database partition which consumes the most resources in your system and focus on it to further your investigation.
When you focus on a specific database partition (either as a result of launching or from the Activity tree) you can also identify which is the dominant resource consumed, in terms of CPU, I/O lock, etc. By identifying your system’s wait type you can formulate an idea as to what kind of solutions will help you improve your system.Note:
| Info |
|---|
If you are working with SAP, PeopleSoft, or Siebel, and ERP support is installed, the Activity tab displays information on the historical Precise for DB2 activity in relation to the ERP application and users, and specific information on executed views and transactions. |
| Anchor | ||||
|---|---|---|---|---|
|
Figure 5-1 Precise 1 Precise for DB2 Activity tab
Tree pane
Details pane
Time frame
Precise bar
Tab Selection bar
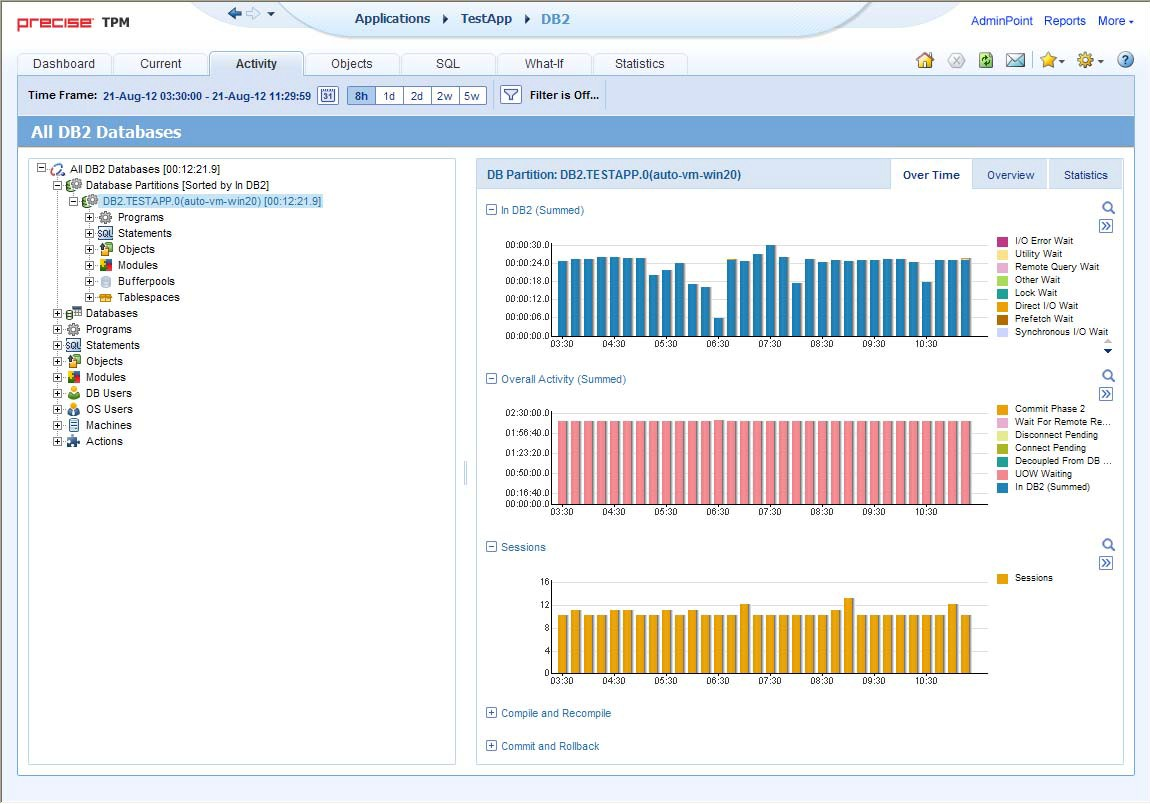
When you open the Activity tab from the Dashboard tab, information on the database partition selected in the Dashboard is displayed, or on All DB2 Databases if the All row was selected. When you open the Activity tab from another tab, the settings from your last visit to the Activity tab are retained, such as a drill down to a Statement entity. This is similar to clicking the History button and returning to a previous tab.
...
You can use the Filter dialog box to filter the Details pane so that only the contribution of certain entities is included. See “Filtering data” on page 19 Filtering data.
The Activity tab is divided into two areas, the Tree pane and the Details pane. A breakdown of the entities that are associated with the selected entity is displayed in the Tree pane. Information on the entity you selected is displayed in the Details pane.
...
The duration value displayed next to each entry reflects the duration of each instance in the selected entity, according to the sort parameter you selected. The sort parameter is displayed next to each entity. The default entity for the top entity in the tree is In DB2 time. See “About About configuring your settings” on page 17settings.
Determining what information is displayed in the Tree
...
To determine what information to display in the tree1 Right
- Right-click on an entity in the tree, and then click Sort and Filter.
...
- In the Associate With dialog box, on the Entries tab, select the entity you want to associate data with from the Populate table with list.
...
- In the Sort entries by list, determine according to which criteria you want the information to be sorted and in which order.
...
- From the Display top list, select the number of rows to display.
...
- On the Criteria tab, do the following for each entity you want to associate data with:
From the left drop-down
...
- list, select an entity.
From the middle drop-down
...
- list, select an operator, such as, Like, <>, Not Like, In, Not In.
In the text
...
- box, type the criteria (case-sensitive) for the selected entity.
If you select the operator Like or Not Like, you can use the % wildcard character. If you select the operator In or Not In, type a comma to separate values.
...
- Click OK.
About viewing information for entities associated with a selected entity
...
You can switch to a different time frame and view additional information on the selected entity that was collected for that time frame. Only the information in the subnodes sub-nodes of the entity you have selected is refreshed.
To select a different time frame1 Click
- Click on the entity in the tree.
...
- In the Time Frame list, select a different time frame than the one already being displayed.
Notice that only the information for the selected entity is refreshed, and it is moved up to the top of the tree.
Refreshing a view
The Refresh option refreshes the display from the PMDB. To refresh the information displayed1 Right
- Right-click on an entity in the tree.
...
- Click Refresh.
Printing the Tree display
You can print an image of what is displayed on the Tree. To print the Tree display1 Right
- Right-click on an entity in the tree.
...
- Click Print.
...
- Use the print functions of your browser to print out an image of the information displayed on the Tree.
About the Details pane in the Activity tab
...
The Details pane displays information corresponding only to the selected tree branch (displayed in the Tree pane). For example, if you drill down on the Programs category associated to a selected Database Partition item, the Details pane displays only information for the Programs under the selected Database Partition item. The selection you make is reflected in the Details pane only; the Tree display remains unchanged.
| Info |
|---|
...
When drilling down in the tree, we filter according to the parent entity. There are two exceptions to this rule: drilling down from Tablespaces to Objects and drilling down from Objects to other entities. For example, drilling down from Objects to Statements does not filter Statements in DB2. |
For some entities, tabs at the top of the Details pane enable you to view additional information. For example, the tabs displayed for a Statement entity are: General and In DB2. Clicking a tab displays different table columns with the same type of associated entities.
When database files are stored on an EMC Storage unit and the Precise for Storage agent is installed, a tab named Storage is displayed. The tab presents a list of storage device used by the DB Partition entity. For each storage device it displays statistics regarding Cache Hit Ratio, Containers and Table Spaces, Requests amounts, Throughput, and I/O rate. See “Storage tab” on page 46 Storage tab.
When information on a selected entity is displayed in table and graph format in the Details pane, there is a direct correlation between the selected entry in the table and the information displayed in the graph below the table. Selecting a different row changes the information displayed in the graph displayed below the table.
...
The Activity tab displays information on different entities. This section provides an overview of all entities, their meaning, and their views. See “The The Precise for DB2 Time Model” on page 12Model.
The following entities can be examined in the Activity tab:■ About
...
...
...
...
...
...
...
...
...
...
...
...
| Anchor | ||||
|---|---|---|---|---|
|
DB2 instances aggregate information from all the databases.
The following table describes the information displayed in the Over Time tab.
Table 5-1 Over 1 Over Time tab
| Item |
|---|
...
| Description |
|---|
| In DB2 (Summed) |
...
| The In DB2 breakdowns over time. | |
| Overall Activity (Summed) |
...
| Application overall activity over time. | |
| Sessions |
...
| Number of sessions over time. |
| Compile and |
...
| Recompile | The time the application spent for compiles and recompiles over time. |
| Commits and |
...
| Rollbacks | The time the application spent for commits and rollbacks over time. |
The following table describes the information displayed in the Overview tab.
Table 5-2 Overview tab
Item Description
...
2 Overview tab
| Item | Description |
|---|---|
| Details | Summed information for the chosen time frame of Total In db2, Sessions, etc. |
| In DB2 (Summed) |
...
| The summed In DB2 breakdowns. | |
| Statistics |
...
| Summed statistics information such as locks escalations, locks timeouts, etc. |
The following table describes the information displayed in the Statistics tab.
Table 5-3 Statistics tabItem Description3 Statistics tab
| Item | Description |
|---|---|
| Rows Read/ |
...
| Written | The number of rows read and written over time. |
| Rows Selected/ |
...
| Affected | The number of rows selected and rows affected over time. |
| Bufferpool Physical I/ |
...
| O | Pages read over time. |
| Locks |
...
| Locks escalations and locks timeouts over time. |
| Anchor | ||||
|---|---|---|---|---|
|
Database partitions list all the information taking place in the database partitions.
...
The following table describes the information displayed in the General tab.
Table 5-4 General tab
Column Description
...
4 General tab
| Column | Description |
|---|---|
| Database Partition | The name of the database: |
| Catalog |
...
| Server | The server of the catalog partition. |
| In DB2 (Summed) |
...
| The In DB2 breakdowns. |
...
| % | The In DB2 percentage as a % of total rows. |
| Statement in DB2 (Avg) |
...
| The average In DB2 time for the statement. | |
| Statement |
...
| Execution | Total statement executions within the selected time. |
| Sessions |
...
| Number of sessions. |
| Info |
|---|
...
As pointed out in the About the Details pane in the Activity tab section, the graph at the bottom of the screen displays detailed information for the Data Partition selected in the table above. |
The following table describes the information displayed in the In DB2 tab.
Table 5-5 In In DB2 tab
| Column |
|---|
...
| Description |
|---|
| Database |
...
| Partition | The name of the database: |
| Catalog |
...
| Server | The server of the catalog partition. |
| In DB2 (Summed) |
...
| The In DB2 breakdowns overtime. | |
| Using |
...
| CPU | In DB2 breakdown description. |
| Waiting for |
...
| CPU | In DB2 breakdown description. |
| Sync I/O |
...
| Wait | In DB2 breakdown description. |
| Direct I/O |
...
| Wait | In DB2 breakdown description. |
| Prefetch |
...
| Wait | In DB2 breakdown description. |
| Lock |
...
| Wait | In DB2 breakdown description. |
| I/O Error |
...
| Wait | In DB2 breakdown description. |
| Remote Query |
...
| Wait | In DB2 breakdown description. |
| Utility |
...
| Active | In DB2 breakdown description. |
The following table describes the information displayed in the Statistics tab.
Table 5-6 Statistics tab
Column Description
...
6 Statistics tab
| Column | Description |
|---|---|
| Database Partition | The name of the database: |
| Catalog |
...
| Server | The server of the catalog partition. |
| Lock |
...
| Escalations | Total number of lock escalations. |
| Lock |
...
| Timeouts | Total number of lock timeouts. |
| BP Data Read I/ |
...
| O | Total data reads (in pages). |
| BP Index Read I/ |
...
| O | Total index reads (in pages). |
| Direct Read/Write I/ |
...
| O | Total of direct reads and writes (in pages). |
| Rows |
...
| Read | Number of rows read. |
| Rows |
...
| Written | Number of rows written. |
| Rows |
...
| Selected | Number of rows selected. |
| Rows |
...
| Affected | Number of rows affected. |
| Internal Row |
...
| Affected | Number of internal rows affected. |
Selected Database Partition
The following table describes the information displayed in the Over Time tab.
Table 5-7 Over Time 7 Over Time tabItem Description
| Item | Description |
|---|---|
| In DB2 (Summed) |
...
| The In DB2 breakdowns over time. | |
| Overall Activity (Summed) |
...
| The application’s overall activity including In DB2 over time. | |
| Sessions |
...
| Number of sessions. |
| Compile and |
...
| Recompile | The time the application spent for commits & recompiles over time. |
| Commits and |
...
| Rollbacks | The time the application spent for commits & rollbacks over time. |
The following table describes the information displayed in Overview tab.
Table 5-8 Overview tab
Item Description
...
8 Overview tab
| Item | Description |
|---|---|
| Details | Detailed activity information. |
| In DB2 (Summed) |
...
| The In DB2 breakdowns. | |
| Statistics |
...
| Statistic counters overview. |
The following table describes the information displayed in the Statistics tab.
Table 5-9 Statistics tabItem Description9 Statistics tab
| Item | Description |
|---|---|
| Rows Read/ |
...
| Written | Number of rows read/written |
...
Table 5-9 Statistics tab
...
| . |
| Rows Selected/ |
...
| Affected | Number of rows selected/affected. |
| Bufferpool Physical I/ |
...
| O | Physical I/O over time (in pages). |
...
| Locks | Number of lock escalations and lock timeouts over time. |
The following table describes the information displayed in the Storage tab.
Table 5-10 Storage tab
Item Description
...
Table 10 Storage tabAnchor StorageTabTable StorageTabTable
| Item | Description |
|---|---|
| Devices in Use | List of devices used by DB2 database partition. Storage Statistics information is shown for each device. Selecting one of devices will present detailed information about the selected device in other components below. |
| Device <unit name> <device number>’s Cache |
...
| Hits | Historical overtime graph of read, write, and combined cache hit ratio (%) of the selected device. |
| Containers and Tablespaces on Device <unit |
...
| name><device number> | List of Containers and Table spaces stored on the selected device. |
| Device <unit name> <device number>’s |
...
| Requests | Historical overtime bars graph for read and write requests for the selected device. |
| Device <unit name> <device number>’s |
...
| Throughput | Historical overtime graph for Throughput (Mb/Sec) of the selected device. |
| Device <unit name> <device number>’s I/O |
...
| Rate | Historical overtime graph for I/O rate (Sec/Req) on the selected device. |
| Anchor | ||||
|---|---|---|---|---|
|
Databases list activity by database. All database partition information is aggregated to the database level.
Database Comparison
The following table describes the information displayed in the General tab.
Table 5-11 General 11 General tab
Column Description
...
| Column | Description |
|---|---|
| Database | Name of the database where the statement is running. |
| In DB2 (Summed) |
...
| The In DB2 breakdowns. | |
| % |
...
| The In DB2 percentage as a % of total rows. |
| Statement In DB2 (Avg) |
...
| The average In DB2 time for the statement. | |
| Statement |
...
| Executions | Total statement executions within the selected time. |
| Sessions |
...
| Number of sessions. |
The following table describes the information displayed in the In DB2 tab.
Table 5-12 In 12 In DB2 tab
Column Description
...
| Column | Description |
|---|---|
| Database | Name of the database where the statement is running. |
| In DB2 (Summed) |
...
| The In DB2 breakdowns overtime. | |
| Using |
...
| CPU | In DB2 breakdown description. |
| Waiting for |
...
| CPU | In DB2 breakdown description. |
| Sync I/O |
...
| Wait | In DB2 breakdown description. |
| Direct I/O |
...
| Wait | In DB2 breakdown description. |
| Prefetch |
...
| Wait | In DB2 breakdown description. |
| Lock |
...
| Wait | In DB2 breakdown description. |
| I/O Error |
...
| Wait | In DB2 breakdown description. |
| Remote Query |
...
| Wait | In DB2 breakdown description. |
| Utility |
...
| Active | In DB2 breakdown description. |
The following table describes the information displayed in the Statistics tab.
Table 5-13 Statistics 13 Statistics tab
Column Description
...
| Column | Description |
|---|---|
| Database | Name of the database where the statement is running. |
| Lock |
...
| Escalations | Total number of lock escalations. |
| Lock |
...
| Timeouts | Total number of lock timeouts. |
| BP Data Read I/ |
...
| O | Total data reads (in pages). |
| BP Index Read I/ |
...
| O | Total index reads (in pages). |
| Direct Read/Write I/ |
...
| O | Total of direct reads and writes (in pages). |
| Rows |
...
| Read | Number of rows read. |
| Rows |
...
| Written | Number of rows written. |
| Rows |
...
| Selected | Number of rows selected. |
| Rows |
...
| Affected | Number of rows affected. |
| Internal Row |
...
| Affected | Number of internal rows affected. |
Selected Database
The following table describes the information displayed in the Over Time tab.
Table 5-14 Over 14 Over Time tab
| Item |
|---|
...
| Description |
|---|
| In DB2 (Summed) |
...
| The In DB2 breakdowns over time. | |
| Overall Activity (Summed) |
...
| The application’s overall activity including In DB2 over time. | |
| Sessions |
...
| Number of sessions |
...
Table 5-14 Over Time tab
Item Description
...
| . | |
| Compile and Recompile | The time the application spent for commits & recompiles over time. |
| Commits and |
...
| Rollbacks | The time the application spent for commits & rollbacks over time. |
The following table describes the information displayed in the Overview tab.
Table 5-15 Overview tab
Item Description
...
15 Overview tab
| Item | Description |
|---|---|
| Details | Detailed activity information. |
| In DB2 (Summed) |
...
| The In DB2 breakdowns. | |
| Statistics |
...
| Statistic counters overview. |
The following table describes the information displayed in the Statistics tab.
Table 5-16 Statistics tabItem Description16 Statistics tab
| Item | Description |
|---|---|
| Rows Read/ |
...
| Written | Number of rows read/written. |
| Rows Selected/ |
...
| Affected | Number of rows selected/affected. |
| Bufferpool Physical I/ |
...
| O | Physical I/O over time (in pages). |
| Locks |
...
| Number of lock escalations and lock timeouts over time. |
The following table describes the information displayed in the Storage tab.
Table 5-17 Storage 17 Storage tab
| Item |
|---|
...
| Description |
|---|
| Devices in |
...
| Use | Information about devices that are in use. |
| Device <unit name> <device number>’s Cache |
...
| Hits | The amount of Cache Hits for the selected device. |
| Containers and Tablespaces on Device <unit |
...
| name><device number> | Information on the Containers and Tablespaces that are defined for this specific device. |
| Device <unit name> <device number>’s |
...
| Requests | The amount of Requests for the selected device. |
| Device <unit name> <device number>’s |
...
| Throughput | The Throughput for the selected device. |
| Device <unit name> <device number>’s I/O |
...
| Rate | The I/O Rate for the selected device. |
| Anchor | ||
|---|---|---|
|
...
|
These are the names of programs that execute Precise for DB2 activity.
Program Comparison
The following table describes the information displayed in the General tab.
Table 5-18 General 18 General tab
Column Description
...
| Column | Description |
|---|---|
| Program | Program name. |
| In DB2 (Summed) |
...
| The In DB2 breakdowns. |
...
| % | The In DB2 percentage as a % of total rows. |
| Statement In DB2 (Avg) |
...
| The average In DB2 time for the statement. | |
| Statement |
...
| Executions | Total statement executions within the selected time. |
| Sessions |
...
| Number of sessions |
...
| . |
The following table describes the information displayed in the In DB2 tab.
Table 5-19 In Table 19 In DB2 tab
| Column |
|---|
...
| Description |
|---|
...
| Program |
...
| Program name. |
| In DB2 (Summed) |
...
| The In DB2 breakdowns overtime. | |
| Using |
...
| CPU | In DB2 breakdown description. |
| Waiting for |
...
| CPU | In DB2 breakdown description. |
| Sync I/O |
...
| Wait | In DB2 breakdown description. |
| Direct I/O |
...
| Wait | In DB2 breakdown description. |
| Prefetch |
...
| Wait | In DB2 breakdown description. |
| Lock |
...
| Wait | In DB2 breakdown description. |
| I/O Error |
...
| Wait | In DB2 breakdown description. |
| Remote Query |
...
| Wait | In DB2 breakdown description. |
| Utility |
...
| Active | In DB2 breakdown description |
...
| . |
The following table describes the information displayed in the Statistics tab.
Table 5-20 Statistics 20 Statistics tab
| Column |
|---|
Column Description
Program Program name
...
| Description | |
|---|---|
| Program | Program name. |
| Lock Escalations | Total number of lock escalations. |
| Lock |
...
| Timeouts | Total number of lock timeouts. |
| BP Data Read I/ |
...
BP Index Read I/O Total index reads (in pages)
| O | Total data reads (in pages) |
...
| . |
| Direct Read/Write I/ |
...
| O | Total of direct reads and writes (in pages). |
| Rows |
...
| Read | Number of rows read. |
| Rows |
...
| Written | Number of rows written. |
Table 5-20 Statistics tab
Column Description
...
| Rows Selected | Number of rows selected. |
| Rows |
...
| Affected | Number of rows affected. |
| Internal Row |
...
| Affected | Number of internal rows affected |
...
| . |
Selected Program
The following table describes the information displayed in the Over Time tab.
Table 5-21 Over 21 Over Time tab
| Column |
|---|
...
| Description |
|---|
| In DB2 (Summed) |
...
| The In DB2 breakdowns over time. | |
| Overall Activity (Summed) |
...
| The application’s overall activity including In DB2 over time. | |
| Sessions |
...
| Number of sessions. |
| Compile and |
...
| Recompile | The time the application spent for commits & recompiles over time. |
| Commits and |
...
| Rollbacks | The time the application spent for commits & rollbacks over time |
...
| . |
The following table describes the information displayed in the Overview tab.
Table 5-22 Overview tab
Column Description
...
22 Overview tab
| Column | Description |
|---|---|
| Details | Detailed activity information. |
| In DB2 (Summed) |
...
| The In DB2 breakdowns. | |
| Statistics |
...
| Statistic counters overview |
...
| . |
The following table describes the information displayed in the Statistics tab.
Table 5-23 Statistics 23 Statistics tab
| Column |
|---|
...
| Description |
|---|
| Rows Read/ |
...
| Written | Number of rows read/written. |
| Rows Selected/ |
...
| Affected | Number of rows selected/affected. |
| Bufferpool Physical I/ |
...
| O | Physical I/O over time (in pages). |
...
| Locks | Number of lock escalations and lock timeouts overtime. |
...
| Anchor | ||||
|---|---|---|---|---|
|
These are the statements Precise for DB2 is executing. Statements are collapsed.
Statement Comparison
The following table describes the information displayed in the General tab.
Table 5-24 General 24 General tab
Column Description
...
| Column | Description |
|---|---|
| Icon | Launch to SQL tab for statement tuning. |
| Statement |
...
| Statement name. |
| In DB2 (Summed) |
...
| The In DB2 breakdowns. | |
| % |
...
| The In DB2 percentage as a % of total rows. |
| In DB2 (Avg) |
...
| The average In DB2 time per statement execution. | |
| Executions |
...
| Total statement executions within the selected time frame. Available for statements, tables, and indexes. |
Text Statement text
...
| Text | Statement text. |
The following table describes the information displayed in the In DB2 tab.
Table 5-25 In 25 In DB2 tab
| Column |
|---|
...
| Description |
|---|
...
| Icon |
...
| Launch to SQL tab for statement tuning. |
| Statement |
...
| Statement name. |
| In DB2 (Summed) |
...
| The In DB2 breakdowns overtime. | |
| Using |
...
| CPU | In DB2 breakdown description. |
| Wait for |
...
| CPU | In DB2 breakdown description. |
| Sync I/O |
...
| Wait | In DB2 breakdown description. |
| Direct I/O |
...
| Wait | In DB2 breakdown description. |
| Prefetch |
...
| Wait | In DB2 breakdown description. |
| Lock |
...
| Wait | In DB2 breakdown description. |
| I/O Error |
...
| Wait | In DB2 breakdown description. |
| Remote Query |
...
| Wait | In DB2 breakdown description. |
| Utility |
...
| Active | In DB2 breakdown description. |
Selected Statement
The following table describes the information displayed in the Over Time tab.
Table 5-26 Over 26 Over Time tab
| Column |
|---|
...
| Description |
|---|
| In DB2 (Summed) |
...
| The In DB2 breakdowns over time. | |
| In DB2 (Avg) |
...
| The average In DB2 time per statement execution. | |
| Statement |
...
| Executions | Total statement executions within the selected time |
...
...
| . |
The following table describes the information displayed in the Overview tab.
Table 5-27 Overview tab
Column Description
...
27 Overview tab
| Column | Description |
|---|---|
| Details | Detailed activity information and last explain details. |
| In DB2 (Summed) |
...
| The In DB2 breakdowns. | |
| Text |
...
| Statement text. |
...
| Anchor | ||||
|---|---|---|---|---|
|
Lists of tables and indexes in use.
Object Comparison
The following table describes the information displayed in the General tab.
Table 5-28 General tab
Column Description
...
28 General tab
| Column | Description |
|---|---|
| Icon | Launch to Objects tab. |
...
| Type | The object type. |
...
| Object | The object name. |
| Schema |
...
| The object schema name. |
| Base Table |
...
| Name | The name of the table. |
| In DB2 (Summed) |
...
| The In DB2 time. | |
| % |
...
| The In DB2 percentage as a % of total rows. |
| Sequential Prefetch I/ |
...
| O | I/O time used for sequential prefetch. |
| List Prefetch I/ |
...
| O | I/O time used for list prefetch. |
| No Prefetch I/ |
...
| O | I/O time used with no prefetch. |
Selected Object
The following table describes the information displayed in the Overview tab.
Table 5-29 Overview tab
Column Description
...
Table 29 Overview tab
| Column | Description |
|---|---|
| Details | Object details. |
| In DB2 (Summed) |
...
| The In DB2 time. | |
| Prefetched I/O (Summed) |
...
| Over time information or I/O separated by Sequential prefetch, List prefetch, and No prefetch. |
| Anchor | ||
|---|---|---|
|
...
|
This is a list of the machines from which the users are logging in.
Machine Comparison
The following table describes the information displayed in the General tab.
Table 5-30 General Table 30 General tab
Column Description
...
| Column | Description |
|---|---|
| Machine | Machine name. |
| In DB2 (Summed) |
...
| The In DB2 breakdowns. | |
| % |
...
| The In DB2 percentage as a % of total rows. |
| Statement In DB2 (Avg) |
...
| The average In DB2 time for the statement. | |
| Statement |
...
| Executions | Total statement executions within the selected time. |
| Sessions |
...
| Number of sessions |
...
| . |
The following table describes the information displayed in the In DB2 tab.
Table 5-31 In Table 31 In DB2 tab
Column Description
...
| Column | Description |
|---|---|
| Machine | Machine name. |
| In DB2 (Summed) |
...
| The In DB2 breakdowns overtime. | |
| Using |
...
| CPU | In DB2 breakdown description. |
| Waiting for |
...
| CPU | In DB2 breakdown description. |
| Sync I/O |
...
| Wait | In DB2 breakdown description. |
| Direct I/O |
...
| Wait | In DB2 breakdown description. |
| Prefetch |
...
| Wait | In DB2 breakdown description. |
| Lock |
...
| Wait | In DB2 breakdown description. |
| I/O Error |
...
| Wait | In DB2 breakdown description. |
| Remote Query |
...
| Wait | In DB2 breakdown description. |
| Utility |
...
| Active | In DB2 breakdown description |
...
| . |
The following table describes the information displayed in the Statistics tab.
Table 5-32 Statistics 32 Statistics tab
| Column |
|---|
Column Description
Machine Machine name
...
| Description | |
|---|---|
| Machine | Machine name. |
| Lock Escalations | Total number of lock escalations. |
| Lock |
...
| Timeouts | Total number of lock timeouts. |
| BP Data Read I/ |
...
| O | Total data reads (in pages). |
| BP Index Read I/ |
...
| O | Total index reads (in pages). |
| Direct Read/Write I/ |
...
| O | Total of direct reads and writes (in pages). |
| Rows |
...
| Read | Number of rows read. |
| Rows |
...
| Written | Number of rows written. |
Table 5-32 Statistics tab
Column Description
...
| Rows Selected | Number of rows selected. |
| Rows |
...
| Affected | Number of rows affected. |
| Internal Row |
...
| Affected | Number of internal rows affected |
...
Selected Machine
The following table describes the information displayed in the Over Time tab.
Table 5-33 Over 33 Over Time tab
| Item |
|---|
...
| Description |
|---|
| In DB2 (Summed) |
...
| The In DB2 breakdowns over time. | |
| Overall Activity (Summed) |
...
| The application's overall activity including In DB2 over time. | |
| Sessions |
...
| Number of sessions. |
| Compile and |
...
| Recompile | The time the application spent for commits & recompiles over time. |
| Commits and |
...
| Rollbacks | The time the application spent for commits & rollbacks over time |
...
| . |
The following table describes the information displayed in the Overview tab.
Table 5-34 Overview tab
Item Description
...
34 Overview tab
| Item | Description |
|---|---|
| Details | Detailed activity information. |
| In DB2 (Summed) |
...
| The In DB2 breakdowns. |
...
| Statistics | Statistic counters overview. |
The following table describes the information displayed in the Statistics tab.
Table 5-35 Statistics Table 35 Statistics tab
| Item |
|---|
...
| Description |
|---|
| Rows Read/ |
...
| Written | Number of rows read/written. |
| Rows Selected/ |
...
| Affected | Number of rows selected/affected. |
| Bufferpool Physical I/ |
...
| O | Physical I/O over time (in pages). |
| Locks |
...
| Number of lock escalations and lock timeouts over time |
...
| . |
| Anchor | ||||
|---|---|---|---|---|
|
...
Modules represent the name of the package that was activated.
Module Comparison
The following table describes the information displayed in the General tab.
Table 5-36 General tab
Column Description
...
Table 36 General tab
| Column | Description |
|---|---|
| Module | Module name. |
| In DB2 (Summed) |
...
| The In DB2 breakdowns. | |
| % |
...
| The In DB2 percentage as a % of total rows. |
| Statement In DB2 (Avg) |
...
| The average In DB2 time for the statement. | |
| Statement |
...
| Executions | Total statement executions within the selected time. |
...
| Sessions | Number of sessions |
...
| . |
The following table describes the information displayed in the In DB2 tab.
Table 5-37 In Table 37 In DB2 tab
| Column |
|---|
...
| Description |
|---|
...
| Module |
...
| Module name. |
| In DB2 (Summed) |
...
| The In DB2 breakdowns overtime. | |
| Using |
...
| CPU | In DB2 breakdown description. |
| Waiting for |
...
| CPU | In DB2 breakdown description. |
| Sync I/O |
...
| Wait | In DB2 breakdown description. |
| Direct I/O |
...
| Wait | In DB2 breakdown description. |
| Prefetch |
...
| Wait | In DB2 breakdown description. |
| Lock |
...
| Wait | In DB2 breakdown description. |
| I/O Error |
...
| Wait | In DB2 breakdown description. |
| Remote Query |
...
| Wait | In DB2 breakdown description. |
| Utility |
...
| Active | In DB2 breakdown description |
...
| . |
The following table describes the information displayed in the Statistics tab.
Table 5-38 Statistics tab
Column Description
Module Module name
...
38 Statistics tab
| Column | Description |
|---|---|
| Module | Module name. |
| Lock Escalations | Total number of lock escalations. |
| Lock |
...
| Timeouts | Total number of lock timeouts. |
| BP Data Read I/ |
...
| O | Total data reads (in pages). |
| BP Index Read I/ |
...
| O | Total index reads (in pages). |
| Direct Read/Write I/ |
...
| O | Total of direct reads and writes (in pages). |
| Rows |
...
| Read | Number of rows read. |
| Rows |
...
| Written | Number of rows written. |
Table 5-38 Statistics tab
Column Description
...
| Rows Selected | Number of rows selected. |
| Rows |
...
| Affected | Number of rows affected. |
| Internal Row |
...
| Affected | Number of internal rows affected |
...
| . |
Selected Module
The following table describes the information displayed in the Over Time tab.
Table 5-39 Over 39 Over Time tab
| Item |
|---|
...
| Description |
|---|
| In DB2 (Summed) |
...
| The In DB2 breakdowns over time. | |
| Overall Activity (Summed) |
...
| The application's overall activity including In DB2 over time. | |
| Sessions |
...
| Number of sessions. |
| Compile and |
...
| Recompile | The time the application spent for commits & recompiles over time. |
| Commits and |
...
| Rollbacks | The time the application spent for commits & rollbacks over time |
...
| . |
The following table describes the information displayed in the Overview tab.
Table 5-40 Overview 40 Overview tab
Item Description
...
| Item | Description |
|---|---|
| Details | Detailed activity information. |
| In DB2 (Summed) |
...
| The In DB2 breakdowns. | |
| Statistics |
...
| Statistic counters overview |
...
| . |
The following table describes the information displayed in the Statistics tab.
Table 5-41 Statistics 41 Statistics tab
| Item |
|---|
...
| Description |
|---|
| Rows Read/ |
...
| Written | Number of rows read/written. |
| Rows Selected/ |
...
| Affected | Number of rows selected/affected. |
| Bufferpool Physical I/ |
...
| O. | Physical I/O over time (in pages). |
...
| Locks | Number of lock escalations and lock timeouts over time. |
...
| Anchor | ||||
|---|---|---|---|---|
|
These are the account strings that were activated from the client information.
Action Comparison
The following table describes the information displayed in the General tab.
Table 5-42 General tab
Column Description
...
42 General tab
| Column | Description |
|---|---|
| Action | Action name. |
| In DB2 (Summed) |
...
| The In DB2 breakdowns. | |
| % |
...
| The In DB2 percentage as a % of total rows. |
| Statement In DB2 (Avg) |
...
| The average In DB2 time for the statement. | |
| Statement |
...
| Executions | Total statement executions within the selected time. |
...
| Sessions | Number of sessions |
...
| . |
The following table describes the information displayed in the In DB2 tab.
Table 5-43 In 43 In DB2 tab
| Column |
|---|
...
| Description |
|---|
...
| Action |
...
| Action name. |
| In DB2 (Summed) |
...
| The In DB2 breakdowns overtime. | |
| Using |
...
| CPU | In DB2 breakdown description. |
| Waiting for |
...
| CPU | In DB2 breakdown description. |
| Sync I/O |
...
| Wait | In DB2 breakdown description. |
| Direct I/O |
...
| Wait | In DB2 breakdown description. |
| Prefetch |
...
| Wait | In DB2 breakdown description. |
| Lock |
...
| Wait | In DB2 breakdown description. |
| I/O Error |
...
| Wait | In DB2 breakdown description. |
| Remote Query |
...
| Wait | In DB2 breakdown description. |
| Utility |
...
| Active | In DB2 breakdown description |
...
| . |
The following table describes the information displayed in the Statistics tab.
Table 5-44 Statistics Table 44 Statistics tab
Column Description
Action Action name
...
| Column | Description |
|---|---|
| Action | Action name. |
| Lock Escalations | Total number of lock escalations. |
| Lock |
...
| Timeouts | Total number of lock timeouts. |
| BP Data Read I/ |
...
| O | Total data reads (in pages). |
| BP Index Read I/ |
...
| O | Total index reads (in pages). |
| Direct Read/Write I/ |
...
| O | Total of direct reads and writes (in pages). |
| Rows |
...
| Read | Number of rows read. |
| Rows |
...
| Written | Number of rows written. |
Table 5-44 Statistics tab
Column Description
...
| Rows Selected | Number of rows selected. |
| Rows |
...
| Affected | Number of rows affected. |
| Internal Row |
...
| Affected | Number of internal rows affected. |
Selected Action
The following table describes the information displayed in the Over Time tab.
Table 5-45 Over 45 Over Time tab
| Item |
|---|
...
| Description |
|---|
| In DB2 (Summed) |
...
| The In DB2 breakdowns over time. | |
| Overall Activity (Summed) |
...
| The application’s overall activity including In DB2 over time. |
...
| Sessions | Number of sessions. |
| Compile and |
...
| Recompile | The time the application spent for commits & recompiles over time. |
| Commits and |
...
| Rollbacks | The time the application spent for commits & rollbacks over time |
...
| . |
The following table describes the information displayed in the Overview tab.
Table 5-46 Overview 46 Overview tab
Item Description
...
| Item | Description |
|---|---|
| Details | Detailed activity information. |
| In DB2 (Summed) |
...
| The In DB2 breakdowns. | |
| Statistics |
...
| Statistic counters overview |
...
| . |
The following table describes the information displayed in the Statistics tab.
Table 5-47 Statistics 47 Statistics tab
| Item |
|---|
...
| Description |
|---|
| Rows Read/ |
...
| Written | Number of rows read/written. |
| Rows Selected/ |
...
| Affected | Number of rows selected/affected. |
| Bufferpool Physical I/ |
...
| O | Physical I/O over time (in pages). |
| Locks |
...
| Number of lock escalations and lock timeouts over time. |
| Anchor | ||
|---|---|---|
|
...
|
These are the names of the users that logged into the machine and executed activity in DB2.
OS User Comparison
The following table describes the information displayed in the General tab.
Table 5-48 General tab
Column Description
...
48 General tab
| Column | Description |
|---|---|
| OS User | OS User name. |
| In DB2 (Summed) |
...
| The In DB2 breakdowns. | |
| % |
...
| The In DB2 percentage as a % of total rows. |
| Statement In DB2 (Avg) |
...
| The average In DB2 time for the statement. | |
| Statement |
...
| Executions | Total statement executions within the selected time. |
| Sessions |
...
| Number of sessions. |
The following table describes the information displayed in the In DB2 tab.
Table 5-49 In 49 In DB2 tab
| Column |
|---|
...
| Description |
|---|
...
| OS User | OS |
...
| User name. |
| In DB2 (Summed) |
...
| The In DB2 breakdowns overtime. | |
| Using |
...
| CPU | In DB2 breakdown description. |
| Waiting for |
...
| CPU | In DB2 breakdown description. |
| Sync I/O |
...
| Wait | In DB2 breakdown description. |
| Direct I/O |
...
| Wait | In DB2 breakdown description. |
| Prefetch |
...
| Wait | In DB2 breakdown description. |
| Lock |
...
| Wait | In DB2 breakdown description. |
| I/O Error |
...
| Wait | In DB2 breakdown description. |
| Remote Query |
...
| Wait | In DB2 breakdown description. |
| Utility |
...
| Active | In DB2 breakdown description. |
The following table describes the information displayed in the Statistics tab.
Table 5-50 Statistics tab
Column Description
OS User OS User name
...
50 Statistics tab
| Column | Description |
|---|---|
| OS User | OS User name. |
| Lock Escalations | Total number of lock escalations. |
| Lock |
...
| Timeouts | Total number of lock timeouts. |
| BP Data Read I/ |
...
| O | Total data reads (in pages). |
| BP Index Read I/ |
...
| O | Total index reads (in pages). |
| Direct Read/Write I/ |
...
| O | Total of direct reads and writes (in pages). |
| Rows |
...
| Read | Number of rows read. |
| Rows |
...
| Written | Number of rows written. |
Table 5-50 Statistics tab
Column Description
...
| Rows Selected | Number of rows selected. |
| Rows |
...
| Affected | Number of rows affected. |
| Internal Row |
...
| Affected | Number of internal rows affected. |
Selected OS User
The following table describes the information displayed in the Over Time tab.
Table 5-51 Over Table 51 Over Time tab
| Item |
|---|
...
| Description |
|---|
| In DB2 (Summed) |
...
| The In DB2 breakdowns over time. | |
| Overall Activity (Summed) |
...
| The application’s overall activity including In DB2 over time. | |
| Sessions |
...
| Number of sessions. |
| Compile and |
...
| Recompile | The time the application spent for commits & recompiles over time. |
| Commits and |
...
| Rollbacks | The time the application spent for commits & rollbacks over time. |
The The following table describes the information displayed in the Overview tab.
Table 5-52 Overview Table 52 Overview tab
Item Description
...
| Item | Description |
|---|---|
| Details | Detailed activity information. |
| In DB2 (Summed) |
...
| The In DB2 breakdowns. | |
| Statistics |
...
| Statistic counters overview |
...
| . |
The following
Table 5-53 Statistics tab
...
table describes the information displayed in the Statistics tab.
Table 53 Statistics tab
| Item | Description |
|---|---|
| Rows Read/ |
...
| Written | Number of rows read/written. |
| Rows Selected/ |
...
| Affected | Number of rows selected/affected. |
| Bufferpool Physical I/ |
...
| O | Physical I/O over time (in pages). |
| Locks |
...
| Number of lock escalations and lock timeouts over time. |
| Anchor | ||
|---|---|---|
|
...
|
These are the names of the users that logged into the DB2 database.
DB User Comparison
The following table describes the information displayed in the General tab.
Table 5-54 General tab
Column Description
...
54 General tab
| Column | Description |
|---|---|
| DB User | Database User name. |
| In DB2 (Summed) |
...
| The In DB2 breakdowns. | |
| % |
...
| The In DB2 percentage as a % of total rows. |
| Statement In DB2 (Avg) |
...
| The average In DB2 time for the statement. | |
| Statement |
...
| Executions | Total statement executions within the selected time. |
| Sessions |
...
| Number of sessions |
...
| . |
The following table describes the information displayed in the In DB2 tab.
Table 5-55 In 55 In DB2 tab
| Column |
|---|
...
| Description |
|---|
| DB |
...
| User | Database User name. |
| In DB2 (Summed) |
...
| The In DB2 breakdowns overtime. | |
| Using |
...
| CPU | In DB2 breakdown description. |
| Waiting for |
...
| CPU | In DB2 breakdown description. |
| Sync I/O |
...
| Wait | In DB2 breakdown description. |
| Direct I/O |
...
| Wait | In DB2 breakdown description. |
| Prefetch |
...
| Wait | In DB2 breakdown description. |
| Lock |
...
| Wait | In DB2 breakdown description. |
| I/O Error |
...
| Wait | In DB2 breakdown description. |
| Remote Query |
...
| Wait | In DB2 breakdown description. |
| Utility |
...
| Active | In DB2 breakdown description. |
The following table describes the information displayed in the Statistics tab.
Table 5-56 Statistics 56 Statistics tab
| Column |
|---|
...
| Description |
|---|
| DB |
...
| User | Database User name. |
| Lock |
...
| Escalations | Total number of lock escalations. |
| Lock |
...
| Timeouts | Total number of lock timeouts. |
| BP Data Read I/ |
...
| O | Total data reads (in pages). |
| BP Index Read I/ |
...
| O | Total index reads (in pages). |
| Direct Read/Write I/ |
...
| O | Total of direct reads and writes (in pages). |
| Rows |
...
| Read | Number of rows read. |
| Rows |
...
| Written | Number of rows written. |
Table 5-56 Statistics tab
Column Description
Rows Selected Number of rows selected
...
| Rows Selected | Number of rows selected. |
| Rows Affected | Number of rows affected. |
| Internal Row |
...
| Affected | Number of internal rows affected |
...
| . |
Selected DB User
The following table describes the information displayed in the Over Time tab.
Table 5-57 Over 57 Over Time tab
| Item |
|---|
...
| Description |
|---|
| In DB2 (Summed) |
...
| The In DB2 breakdowns over time. | |
| Overall Activity (Summed) |
...
| The application’s overall activity including In DB2 over time. |
...
| Sessions | Number of sessions. |
| Compile and |
...
| Recompile | The time the application spent for commits & recompiles over time. |
| Commits and |
...
| Rollbacks | The time the application spent for commits & rollbacks over time. |
The following table describes the information displayed in the Overview tab.
Table 5-58 Overview tab
Item Description
...
58 Overview tab
| Item | Description |
|---|---|
| Details | Detailed activity information. |
| In DB2 (Summed) |
...
| The In DB2 breakdowns. | |
| Statistics |
...
| Statistic counters overview. |
The following table describes the information displayed in the Statistics tab.
Table 5-59 Statistics 59 Statistics tab
| Item |
|---|
...
| Description |
|---|
| Rows Read/ |
...
| Written | Number of rows read/written. |
| Rows Selected/ |
...
| Affected | Number of rows selected/affected. |
| Bufferpool Physical I/ |
...
| O | Physical I/O over time (in pages). |
| Locks |
...
| Number of lock escalations and lock timeouts over time. |
| Anchor | ||
|---|---|---|
|
...
|
Tablespaces list activity by Tablespace. This entity is only available for the Database and Database Partition entities. To display activity by tablespace, drill from the Database or Database Partition to the tablespaces entity.
The following table describes the information displayed in the General tab.
Tablespace Comparison
...
Table 5-60 General tab
Column Description
...
60 General tab
| Column | Desription |
|---|---|
| Tablespace | The name of the tablespace. |
| I/O Time (Summed) |
...
| Total I/O time breakdown. | |
| I/O |
...
| Count | Total I/O count breakdown (in pages). |
| Page |
...
| Size | The tablespace’s page size. |
| Pages |
...
| The number of pages. |
| No Victim |
...
| Available | The number of times an agent did not have a pre-selected victim buffer available. |
The following table describes the information displayed in the I/O Time tab.
Table 5-61 I61 I/O Time tab
| Column |
|---|
...
| Description |
|---|
...
| Tablespace |
...
| The name of the tablespace. |
| I/O Time (Summed) |
...
| Total I/O time breakdown. | |
| Synchronous Read |
...
| Time | The total Synchronous Read Time. |
| Asynchronous Read |
...
| Time | The total Asynchronous Read Time. |
| Direct Read |
...
| Time | The total Direct Read Time. |
| Synchronous Write |
...
| Time | The total Synchronous Write Time. |
| Asynchronous Write |
...
| Time | The total Asynchronous Write Time. |
| Direct Write |
...
| Time | The total Direct Write Time |
...
| . |
The following table describes the information displayed in the I/O Count tab.
Table 5-62 I62 I/O Count tab
| Column |
|---|
...
| Description |
|---|
...
| Tablespace |
...
| The name of the tablespace. |
| I/O |
...
| Count | The total I/O Count. |
| Synchronous Data |
...
| Reads | The total Synchronous Data Reads. |
| Synchronous Index |
...
| Reads | The total Synchronous Index Reads. |
| Asynchronous Data |
...
| Reads | The total Asynchronous Data Reads. |
| Asynchronous Index |
...
| Reads | The total Asynchronous Index Reads. |
| Direct |
...
| Reads | The total Direct Reads. |
| Synchronous Data |
...
| Writes | The total Synchronous Data Writes. |
| Synchronous Index |
...
| Writes | The total Synchronous Index Writes. |
| Asynchronous Data |
...
| Writes | The total Asynchronous Data Writes. |
| Asynchronous Index |
...
| Writes | The total Asynchronous Index Writes. |
| Direct |
...
| Writes | The total Direct Writes |
...
| . |
The following table describes the information displayed in the Response Time tab.
Table 5-63 Response Table 63 Response Time tab
| Column |
|---|
...
| Description |
|---|
...
| Tablespace |
...
| The name of the tablespace. |
| Synchronous Read Response Time |
...
| The average Synchronous Read Response Time. |
| Asynchronous Read Response |
...
| The average Asynchronous Read Response. |
| Direct Read Response |
...
| Time | The average Direct Read Response Time. |
| Synchronous Write Response Time |
...
| The average Synchronous Write Response Time. |
| Asynchronous Write Response |
...
| The average Asynchronous Write Response. |
| Direct Write Response |
...
| Time | The average Direct Write Response Time |
...
| . |
Selected Tablespace
The following table describes the information displayed in the Over Time tab.
Table 5-64 Over 64 Over Time tab
| Item |
|---|
...
| Description |
|---|
| Hit |
...
| Ratio | The tablespace Hit Ratio over time. |
| I/O |
...
| Time | The tablespace I/O time breakdown over time. |
| Response Time (Avg) |
...
| The tablespace average Response Time over time. | |
| I/O |
...
| Count | The tablespace I/O Count breakdown over time (in pages) |
...
| . |
The following table describes the information displayed in the Overview tab.
Table 5-65 Overview tab
Item Description
...
65 Overview tab
| Item | Description |
|---|---|
| Details | Details about the selected tablespace. |
| I/O |
...
| Time | Total I/O time breakdowns (in Pie chart). |
| I/O |
...
| Count | Total I/O Count breakdowns (in Pie chart). |
| Anchor | ||
|---|---|---|
|
...
|
Bufferpools list activity by Bufferpool. This entity is only available for the Database and Database Partition entities. To display activity by bufferpool, drill from the Database or Database Partition to the Bufferpools entity.
...
Bufferpool Comparison
The following table describes the information displayed in the General tab.
Table 5-66 General Table 66 General tab
Column Description
...
| Column | Description |
|---|---|
| Bufferpool | The name of the bufferpool. |
| I/O Time (Summed) |
...
| Total I/O time breakdown. | |
| I/O |
...
| Count | Total I/O count breakdown (in pages). |
| Page |
...
| Size | The bufferpool’s page size. |
| Pages |
...
| The number of pages. |
| No Victim |
...
| Available | The number of times an agent did not have a pre-selected victim buffer available. |
The following table describes the information displayed in the I/O Time tab.
Table 5-67 ITable 67 I/O Time tab
| Column |
|---|
...
| Description |
|---|
...
| Bufferpool |
...
| The name of the bufferpool. |
| I/O Time (Summed) |
...
| Total I/O time breakdown. | |
| Synchronous Read |
...
| Time | The total Synchronous Read Time. |
| Asynchronous Read |
...
| Time | The total Asynchronous Read Time. |
| Direct Read |
...
| Time | The total Direct Read Time. |
| Synchronous Write |
...
| Time | The total Synchronous Write Time. |
| Asynchronous Write |
...
| Time | The total Asynchronous Write Time. |
| Direct Write |
...
| Time | The total Direct Write Time |
...
| . |
The following
table describes the information displayed in the I/O Count tab.
Table 68 ITable 5-68 I/O Count tab
| Column |
|---|
...
| Description |
|---|
...
| Bufferpool |
...
| The name of the bufferpool. |
| I/O |
...
| Count | The total I/O Count. |
| Synchronous Data |
...
| Reads | The total Synchronous Data Reads. |
| Synchronous Index |
...
| Reads | The total Synchronous Index Reads. |
| Asynchronous Data |
...
| Reads | The total Asynchronous Data Reads. |
| Asynchronous Index |
...
| Reads | The total Asynchronous Index Reads. |
| Direct |
...
| Reads | The total Direct Reads. |
| Synchronous Data |
...
| Writes | The total Synchronous Data Writes. |
| Synchronous Index |
...
| Writes | The total Synchronous Index Writes. |
| Asynchronous Data |
...
| Writes | The total Asynchronous Data Writes. |
| Asynchronous Index |
...
| Writes | The total Asynchronous Index Writes. |
Table 5-68 I/O Count tab
Column Description
...
| Direct Writes | The total Direct Writes |
...
| . |
The following table describes the information displayed in the Response Time tab.
Table 5-69 Response 69 Response Time tab
| Column |
|---|
...
| Description |
|---|
...
| Bufferpool |
...
| The bufferpool name. |
| Synchronous Read Response Time |
...
| The average Synchronous Read Response Time. |
| Asynchronous Read Response |
...
| The average Asynchronous Read Response. |
| Direct Read Response |
...
| Time | The average Direct Read Response Time. |
| Synchronous Write Response Time |
...
| The average Synchronous Write Response Time. |
| Asynchronous Write Response |
...
| The average Asynchronous Write Response. |
| Direct Write Response |
...
| Time | The average Direct Write Response Time |
...
| . |
Selected Bufferpool
The following table describes the information displayed in the Over Time tab.
Table 5-70 Over Table 70 Over Time tab
| Item |
|---|
...
| Description |
|---|
| Hit |
...
| Ratio | The bufferpool Hit Ratio over time. |
| I/O |
...
| Time | The bufferpool I/O time breakdown over time. |
| Response Time (Avg) |
...
| The bufferpool average Response Time over time. | |
| I/O |
...
| Count | The bufferpool I/O Count breakdown over time (in pages) |
...
| . |
The following table describes the information displayed in the Overview tab.
Table 5-71 Overview tab
Item Description
...
71 Overview tab
| Item | Description |
|---|---|
| Details | Details about the selected bufferpool. |
| I/O |
...
| Time | Total I/O time breakdowns. |
| I/O |
...
| Count | Total I/O Count breakdowns. |
Precise. Performance intelligence from click to storage. Learn more > >
...
...