Page History
...
| Anchor | ||||
|---|---|---|---|---|
|
The SQL tab lets you analyze execution plans and explain results so that you can tune statements and achieve optimal results.
...
After a statement is explained, the explain results are stored in the PMDB. This information includes the objects referenced by the statement and the operations performed on these objects. The top statements are automatically explained every day. You can control how many statements to explain using a setting for the Explain Statements PMDB process in AdminPoint. See the the Precise Administration Guide for details.
Understanding the execution plan chosen by the DB2 Optimizer is extremely important when tuning your application. You can ensure optimal system performance by ensuring that the best plans are used for your queries.
...
The following table shows from which tabs and entities it is possible to launch to the SQL tab, in context
Table 7- 1 Launch in-context to following entities
| Tab | Entities |
|---|---|
| Dashboard | Statement |
| Current | Statement, Active or Current Session that is currently executing a statement. |
| Activity | Statement |
| What-If | Statement that is affected by one or more index evaluations. |
| Info |
|---|
If the SQL tab is opened with no statement in-context, the following error message is displayed:
|
...
There can be statements with many execution plans. See “About the Dashboard tab” on page 23, “About the Current tab” on page 30, “About the Activity tab” on page 39, and “About the Objects tab” on page 67.
| Anchor | ||||
|---|---|---|---|---|
|
The following sections explain how to view information and navigate through the SQL tab:
- About viewing the execution plan of a statement
- About interpreting text highlighting on the Highlights tab
- About viewing which objects are referenced by the execution plan
- About viewing information on all operators and predicates in the Execution plan
- About viewing the statement text
- About viewing recommended indexes for a statement
- About viewing additional execution plan details
| Anchor | ||||
|---|---|---|---|---|
|
The Plan Tree area displays the execution plan of a statement and related information, such as statistics, referenced objects, and operations performed in the execution plan. It lets you assess and tune statements based on real information.
...
The following table describes the information displayed in each tab of the Plan view.
Table 7- 2 Information tabs
| Information Tabs | Description | ||
|---|---|---|---|
| Highlights | The default tab, it displays the statement’s Optimized text. When opening a new plan tree or when clicking on the root of the tree, the original text is displayed (Text tab). When an operator is clicked, the text will be switched to the optimized text of the statement. | ||
| Objects | Displays information on all referenced objects in the execution plan, including their tables, indexes, and columns. Statistical and general details are displayed for each object. | ||
| Operators | Displays information on all operators in the Execution plan tree. When you sort a table, you can locate operators by their total cost or by any other column in the table. | ||
| Text | Displays the Original text of the statement. | ||
| Recommendations | Displays new index recommendations for the statement. These are additional indexes that can improve the statement.
|
About the Execution Plan tree
The Execution Plan tree displays both the Virtual execution plan and the Estimated execution plan, of the specified statement.
The execution plan's text appears both in the Text View area (Text tab) at the bottom of the execution plan tree and at the top of the Details area (also a Text tab). The text that relates to the selected step in the Plan tree is highlighted. This lets you view the text of the statement, the execution plan, and additional information, such as the objects referenced by the statement, all at once. In the Text View area you can also view two additional tabs displaying Optimized Text and Remote Query Text.
Actions that can be performed on the tree
You can perform the following actions on the execution plan tree:
- The Playback controls, located at the top of the tree, enable you to freely move within the execution plan of an explained statement (step by step).
- By moving the pointer over the execution plan steps, you can view a ToolTip that contains statistical information, such as Estimated Cost, Estimated Rows, and Estimated I/O Cost, and a description of the specified step.
- Selecting a specific step (operator) highlights nested steps and affects the information displayed in the Detail tabs: the relevant Optimized text is shown on the Highlights tab; the referenced tables, indexes, and columns are shown on the Objects tab; the operators and predicates are shown on the Operators tab; and the Original text is shown on the Text tab. The Recommendations tab, only displayed when you generate recommendations, shows index details and the DDL for creating the indexes.
- Clicking the hatchet mark (
 ), located at the bottom of the tree, displays the Tree View area with three tabs allowing you to select which statement text to view:
- Optimized Text
- Original Text
- Remote Query Text
| Info |
|---|
When launching to the SQL tab, the Highlights tab in the Details area and the Text tab in the Text View area are selected by default. |
| Anchor | ||||
|---|---|---|---|---|
|
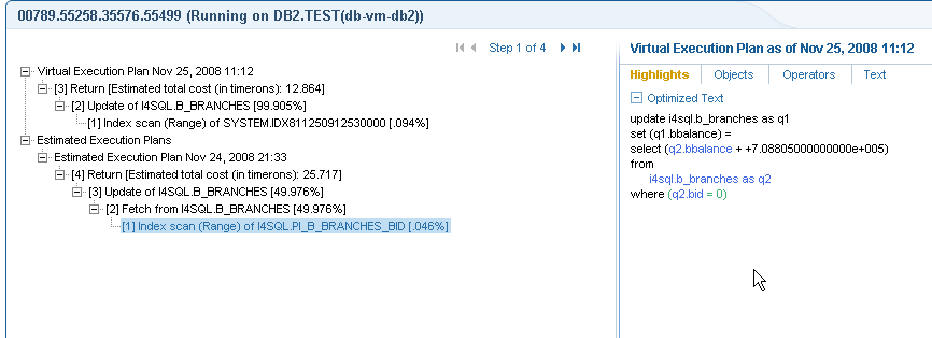
The Highlights tab displays the statement’s Optimized text as generated by the DB2 optimizer. Depending upon the operator selected on the Tree, the text will have different colors highlighting relevant tables, columns, and predicates.
...
Only applied predicates are highlighted. In the following example, the predicate on the bid column is range delimiting.
Figure 1 Highlights tab content
| Info |
|---|
Not all operators include color fonts. Color fonts are used only when relevant for performance tuning. |
| Anchor | ||||
|---|---|---|---|---|
|
The Objects tab displays three tables (Tables used in Plan, Indexes on Table, Columns in Table) that list all referenced objects in the execution plan, including their indexes and columns. Statistical details and general details are displayed for each object and its sub-entities.
The following table describes the information displayed for the referenced tables.
Table 7- 3 Tables used in Plan
| Column | Description |
|---|---|
 | Click to launch to Objects tab—with the selected index in context—to get additional catalog information about the object. |
 | Click to locate and highlight in Bold font all the operators in the execution plan that access the specified index. |
| Table Name | Name of the table. |
| Contribution Ratio | The Contribution ratio of the table, computed by I/O Cost. |
| Prefetch | The Prefetch type (LIST, SEQUENTIAL, or NONE). |
| Statistics Time | The last statistics update. |
| Rows | The number of rows based on last statistics update. |
| Total Pages | The total pages based on last statistics update. |
| Data Pages | The data pages based on last statistics update. |
| Overflow Records | Overflow records based on last statistics update. |
| Preferred Locksize | Preferred locksize based on last statistics update. |
The following table describes the information displayed in the indexes defined on a selected table.
Table 7- 4 Indexes on Table.
Column Description
...
| Column | Description |
|---|---|
| Click to launch to Objects tab—with the selected index in context—to get additional catalog information about the object. |
|
...
| Click to locate and highlight in Bold font all the operators in the execution plan that access the specified index. |
| Index |
...
| Name | Name of the index. |
| Contribution |
...
| Ratio | The Contribution ratio of the table, computed by I/O Cost. |
| Prefetch |
...
| The Prefetch type (LIST, SEQUENTIAL, or NONE). |
| Statistics |
...
| Time | The last statistics update. |
| Unique Rule | Unique |
...
| rule based on last statistics update. |
| Cluster |
...
| Ratio | Cluster ratio based on last statistics update. |
| Cluster Factor | Cluster |
...
| factor based on last statistics update. | |
| Index Leafs | Index |
...
| leafs based on last statistics update. |
| Index |
...
| Levels | Index levels based on last statistics update. |
| Distinct First |
...
| Keys | Distinct first key based on last statistics update. |
| Distinct Full |
...
| Keys | Distinct full keys based on last statistics update. |
| Sequential |
...
| Pages | Sequential pages based on last statistics update. |
| Density |
...
| Density based on last statistics update. |
The following table describes the information displayed in Columns in Table.
Table 7- 5 Columns in table
Column Description
...
| Column | Description |
|---|---|
| Click to launch to Objects tab—with the selected table in context—to get additional catalog information about the object. |
 |
...
| The column definition in the chosen index (Ascending, Descending, or Included). |
| Column |
...
| Column name. |
...
| Type | Data type of the column. |
| Length |
...
| The length of the column. |
| Key |
...
| Number | The position within the chosen index. |
| Anchor | ||||
|---|---|---|---|---|
|
The Operators tab displays information on all operators in the Execution plan tree. When you sort a table, you can locate operators by their total cost or by any other column in the table.
The following table describes the information displayed in the Operators table.
Table 7- 6 Operators table
Column Description
...
| Column | Description |
|---|---|
| Click to locate and highlight in Bold font the same operator in the execution plan. |
| Operator |
...
| ID | Operator ID issued by the DB2 Optimizer. |
| Execution |
...
| Order | The execution order of operators in the plan. |
| Operator |
...
| Operator type. |
| Subtree Total |
...
| Cost | The total cost of this operator subtree. |
| Cost(%) |
...
| The percentage cost of this operator in the plan. | |
| First Row |
...
| Cost | First row cost of the operator subtree. |
| I/O |
...
| Cost | I/O Cost. |
| CPU Cost | CPU |
...
| Cost. |
| Prefetch |
...
| Prefetch type. |
| Estimated |
...
| Rows | The estimated rows of the operator. |
| Estimated |
...
| Pages | The estimated pages of the operator. |
| Potential Filter |
...
| Factor | Potential filter factor calculated by the predicate’s filter factor of the operator. |
| Table |
...
| Partitions | The estimated number of table partitions to be accessed. |
The following table describes the information displayed in the Predicates table.
Table 7-7 Predicates table
Column Description
...
| Column | Description |
|---|---|
| Text | Predicate text. |
| Filter |
...
| Factor | The estimated filter factor of the predicate. |
| How Applied | How |
...
| predicate is being used by the specified operator. |
| Sub |
...
| Select | Indicates when the subquery used in this predicate is evaluated. |
| Anchor | ||||
|---|---|---|---|---|
|
The Text tab displays the statement’s original text.
| Anchor | ||||
|---|---|---|---|---|
|
The Recommendations tab displays the output of the Recommend algorithm. The Recommendations tab is divided into three areas:
...
The following table describes the information displayed in the Recommendations table.
Table 7- 8 Recommendations table
Column Description
...
| Column | Description |
|---|---|
| Object | The name of the index. |
| Actions |
...
| Create index. |
| Columns |
...
| Columns participating in the index or Include Columns in the index. |
The Details area displays statistical information of the recommended index. The DDL area displays the create index statement.
| Anchor | ||||
|---|---|---|---|---|
|
You can view additional execution plan details by hovering over a specific execution plan row with the mouse. A ToolTip is displayed showing some of the following details, depending upon which row you are hovering over:
- Operator Type
- Description
- Estimated Total Cost
- First row cost
- Estimated I/O cost
- Estimated CPU cost
- Estimated communication cost
- Contribution Ratio
- Estimated total cost
- Operator Arguments such as:
- MAXPAGES=ALL
- PREFETCH=NONE
- ROWLOCK=EXCLUSIVE
- SCANDIR=FORWARD
- TABLOCK=INTENT EXCLUSIVE
| Anchor | ||||
|---|---|---|---|---|
|
Use the Actions menu to perform the following operations:
- Creating a new statement
- Opening an existing statement
- Editing an existing statement
- Re-explaining an access plan
- Generating recommendations
| Anchor | ||||
|---|---|---|---|---|
|
You can create a new statement and save it in the PMDB in a logical cabinet and folder hierarchy. You can also rewrite statements and view their access plans.
...
The new statement is saved in the PMDB in a logical cabinet and folder hierarchy.
| Anchor | ||||
|---|---|---|---|---|
|
You can load a previously saved statement. To open an existing statement
- On the Actions menu, click Open. The Open Statement dialog box is displayed.
- In the Open Statement dialog box, select the statement you want to open by choosing its relevant properties from the drop-down lists, as follows:
- Database. The name of the database where the statement is running.
- Cabinet. Cabinet The The name of the cabinet that the statement is saved in.
- Folder. The Folder The name of the folder that the statement is saved in.
- Statement. Statement The The name of the statement.
- Comment. Displays free text entered by the user.
The statement's text is displayed in the Text frame.
- Click OK.
| Info |
|---|
...
If the SQL tab is opened with no statement in-context, the following error message is displayed:
To open a statement you can close the error message dialog and click the Open button displayed on the upper right-hand side of the Details area or click Actions>Open. To open a new statement click Actions>New. |
| Anchor | ||||
|---|---|---|---|---|
|
You can edit a statement that was saved in the PMDB. The statement that was collected by the Collector is saved as a new statement in a logical cabinet and folder hierarchy.
...
- On the Actions menu, click Edit.
- In the Edit Statement dialog box, select the statement you want to edit by choosing its relevant properties from the drop-down lists, as follows:
- Database. The name of the database where the statement is running.
- User. The statement's parsing user.
- Cabinet. The name of the cabinet that the statement is saved in.
- Folder. Folder The The name of the folder that the statement is saved in.
- Statement. The name of the statement.
- Comment. Displays free text entered by the user.
- Enter a new statement name in the Statement field.
- Edit the SQL text for the statement in the Text frame.
- Click OK.
The edited statement is saved in a logical cabinet and folder hierarchy.
| Anchor | ||||
|---|---|---|---|---|
|
You can refresh a statement plan by generating a new estimated access plan and saving it, if it is different from the most recent access plan. You can then display the most recent access plan.
To re-explain a statement, go to Actions>Re-Explain or, alternatively, click the Re-Explain button.
| Anchor | ||||
|---|---|---|---|---|
|
You can generate new index recommendations for the statement. These are additional indexes that can improve the statement.
To generate a recommendation, go to Actions>Recommend or, alternatively, click the Recommend button.
Precise. Performance intelligence from click to storage. Learn more > >
...
...