Page History
...
After a statement is explained, the explain results are stored in the PMDB. This information includes the objects referenced by the statement and the operations performed on these objects. The top statements are automatically explained every day. You can control how many statements to explain using a setting for the Explain Statements PMDB process in AdminPoint. See the Precise Agent InstallerPrecise Administration Guide for details.
Understanding the execution plan chosen by the DB2 Optimizer is extremely important when tuning your application. You can ensure optimal system performance by ensuring that the best plans are used for your queries.
...
| Information Tabs | Description | ||
|---|---|---|---|
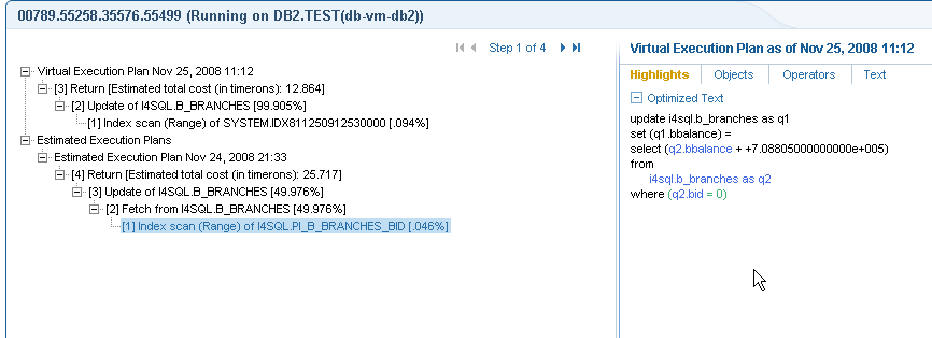
| Highlights | The default tab, it displays the statement’s Optimized text. When opening a new plan tree or when clicking on the root of the tree, the original text is displayed (Text tab). When an operator is clicked, the text will be switched to the optimized text of the statement. | ||
| Objects | Displays information on all referenced objects in the execution plan, including their tables, indexes, and columns. Statistical and general details are displayed for each object. | ||
| Operators | Displays information on all operators in the Execution plan tree. When you sort a table, you can locate operators by their total cost or by any other column in the table. | ||
| Text | Displays the Original text of the statement. | ||
| Recommendations | Displays new index recommendations for the statement. These are additional indexes that can improve the statement.
|
About the Execution Plan tree
...
Only applied predicates are highlighted. In the following example, the predicate on the bid column is range delimiting.
 Note:
Note:
| Info |
|---|
Not all operators include color fonts. Color fonts are used only when relevant for performance tuning. |
| Anchor | ||||
|---|---|---|---|---|
|
...
Table 7-3 Tables used in Plan
Column Description
...
| Column | Description |
|---|---|
 | Click to launch to Objects tab—with the selected index in context—to get additional catalog information about the object. |
...
 | Click to locate and highlight in Bold font all the operators in the execution plan that access the specified index. |
| Table |
...
| Name | Name of the table. |
| Contribution |
...
| Ratio | The Contribution ratio of the table, computed by I/O Cost. |
| Prefetch |
...
| The Prefetch type (LIST, SEQUENTIAL, or NONE). |
| Statistics |
...
| Time | The last statistics update. |
| Rows |
...
| The number of rows based on last statistics update. |
| Total |
...
| Pages | The total pages based on last statistics update. |
Table 7-3 Tables used in Plan
Column Description
...
| Data Pages | The data pages based on last statistics update. |
| Overflow |
...
| Records | Overflow records based on last statistics update. |
| Preferred |
...
| Locksize | Preferred locksize based on last statistics update. |
The following table describes the information displayed in the indexes defined on a selected table.
...