Page History
...
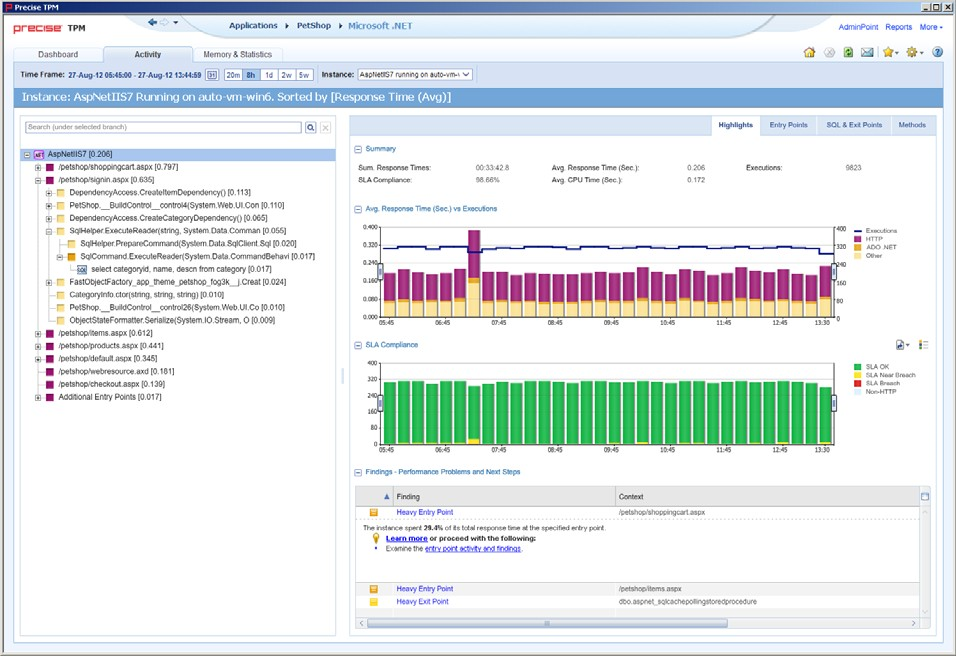
The Activity workspace is divided up into two main areas. The Main area (left pane) features an execution tree of all monitored instances. The Association area (right pane) features analysis tabs that provide specific information about the node selected in the execution tree in the left pane. The workspace heading displays the instance name, the server name, and what field the tree is sorted by.
Figure 4-1 Sample 1 Sample Activity Workspace
About the Main area
The Main area displays an execution tree of the monitored instance, broken down into the following node types:■ All
- All instances (default)
...
- Instance
...
- URI
...
- Method (all types)
...
- SQL (other exit points are methods)
Selecting a node displays information in context for that node and it’s underlying call path in the analysis tabs in the Association area. See “About the Association area” on page 23.
Viewing information in the Main area
By default, the execution tree in the Main area is launched displaying the top instance level (either a selected instance or all monitored instances) and the entry point level only. Navigate through the execution tree by clicking the ‘+’ sign next to the node name. This displays deeper layers of the tree, enabling you to view invoked methods and SQLs while maintaining the execution hierarchy.
| Info |
|---|
...
The degree to which you can drill down in an execution tree is defined by the filtering settings for your application. For more information, see Configuring Precise for .NET in the Precise Administration Guide. |
The following table describes the information displayed in the execution tree.
Table 4-1 Information 1 Information displayed in the execution tree
Field Description
...
| Field | Description |
|---|---|
| Icon | Displays an icon reflecting the node type. |
...
| Name | Displays the name of the selected node. Depending on the tree view settings selected, the name will be displayed either its short name, or its full execution context. |
| Selected |
...
| "Sorted by"value | Displays an aggregated value of the selected “sort by” option for the node’s entire underlying call tree. |
To change the current tree view settings, see “About Tree View settings” on page 13.
Hovering over a node displays a ToolTip. The following table describes the information displayed in the ToolTip:
Table 4-2 Information 2 Information displayed in a node’s ToolTip
Field Description
...
| Field | Description |
|---|---|
| Type | Displays the node’s method type. |
...
| Context | Displays the full execution context of the selected node |
...
| . | |
| Sorted "sorted by" type and value | Displays the field by which the tree view is sorted by and the value for the selected node and its underlying call tree. |
The table below describes the “sort by” options available for the execution tree.
Table 4-3 Sort 3 Sort options for the execution tree
| Sorted |
|---|
...
| by | Description |
|---|---|
| Response Time (Avg) |
...
| Displays the average response time for each node and its underlying call path. The average response time is displayed in seconds. | |
| Response Time (Sum) |
...
| Displays the total response time for each node and its underlying call path. The summed response time is displayed in hours: minutes: seconds: milliseconds. | |
| Work Time (Avg) |
...
| Displays the average work time in seconds for each node. The average work time is displayed in seconds. | |
| Work Time (Sum) |
...
| Displays the summed work time in seconds for each node. The summed work time is displayed in hours: minutes: seconds: milliseconds. | |
| Executions |
...
| Displays the number of executions within each node. |
All of the sort options can be displayed in ascending or descending order. You can also select the maximum number of executions to display under each node, the maximum number of results to display, and whether to display the method’s long or short name.
See “About Tree View settings” on page 13.
Searching within the execution tree
Above the execution tree in the Main area there is a search bar.
...
- Enter the desired value in the search bar.
- Click the search icon to the right of the search field. The heaviest results for the search value are emphasized in bold within the execution tree and their relevant call paths are opened.
...
| Info |
|---|
If the ‘Show short name only’ option is selected in the tree view settings dialog and the user enters the full name in the search value, the search will not return any results. |
About the execution context
Precise for Microsoft .NET displays performance metrics for every instrumented node in the application. The execution context is a sequence of executions, a call path of instrumented methods that defines each node’s unique location within the instrumented application.
About the Association area
The Association area displays a variety of analysis tabs, corresponding to the selected node in the execution tree. See “About the Activity workspace analysis tabs” on page 23.
...