Page History
This section includes the following topics:
- About Precise for Oracle tabs
- How most tabs are structured
- About drilling down in context
- Tasks common to most tabs
- About role management in Precise for Oracle
- How information is collected
- Launching Precise for Oracle from Precise StartPoint
| Anchor | ||||
|---|---|---|---|---|
|
The Precise for Oracle user interface is made up of seven or eight tabs depending on whether Oracle Applications is installed or not. Each tab has a different focus and provides a different view into your application and database performance. You can move between these tabs to examine the information necessary to successfully track your database performance and to identify patterns in resource consumption.
The following table describes which tasks can be performed in each tab.
Table 2- 1 Tabs in Precise for Oracle
Tab Description
Dashboard Lets
| Tab | Description |
|---|---|
| Dashboard | Lets you quickly identify which Oracle instance has a performance problem, providing the first glimpse into where the problem lies. The Dashboard tab also lets you compare performance and statistics among your Oracle instances. |
...
| Current | Lets you identify and solve the performance problems that are happening now. |
| Activity |
...
| Lets you examine the application's performance over time and helps locate performance bottlenecks in its behavior. |
| Objects |
...
| Lets you browse Oracle database objects. It can help you understand the relationships and associations between database schema objects and the SQL statements that access them. It is primarily used for object tuning. |
| SQL |
...
| Lets you tune problematic SQL statements. |
| What- |
...
| If | Lets you simulate the effect of any index change on SQL statements running in your application. |
| Statistics |
...
| Lets you examine Oracle's own statistics and see graphs of their variation over time. It is primarily used for instance tuning. |
| Oracle |
...
| Applications | Lets you identify problems in Oracle Applications concurrent managers and requests. Note that this tab is only available if you have Interpoint for Oracle Applications installed. |
| Anchor | ||||
|---|---|---|---|---|
|
Though each tab is structured differently, most tabs consist of two different areas. Each area can include different control elements, such as tabs and view controls, and displays information in various formats, such as tables, graphs, or charts. The various areas are related to each other in that performing an action in one area affects the information displayed in other areas on the page. For example, the Current tab contains an upper and a lower area. The lower area (Association area) shows information in a table format. Each row in the table represents an application. The upper area (Main area) displays general information on the selected entity as well as related applications.
...
You can control the tab by doing any of the following:
- Keeping the selected entity but changing the associated entities—by entities. By selecting a different entity from the Association controls in the Association area.
- Changing the selected entity—by entity. By selecting a row in the Association area.
- Changing the view for the selected entity—by entity. By selecting a different view in the Main area.
...
In the Association area, click the row of the application you want to view detailed information for. The Tab heading indicates the newly selected entity; the Main area displays information on the application you drilled down to, and the Association area shows information on statements executed by this application.
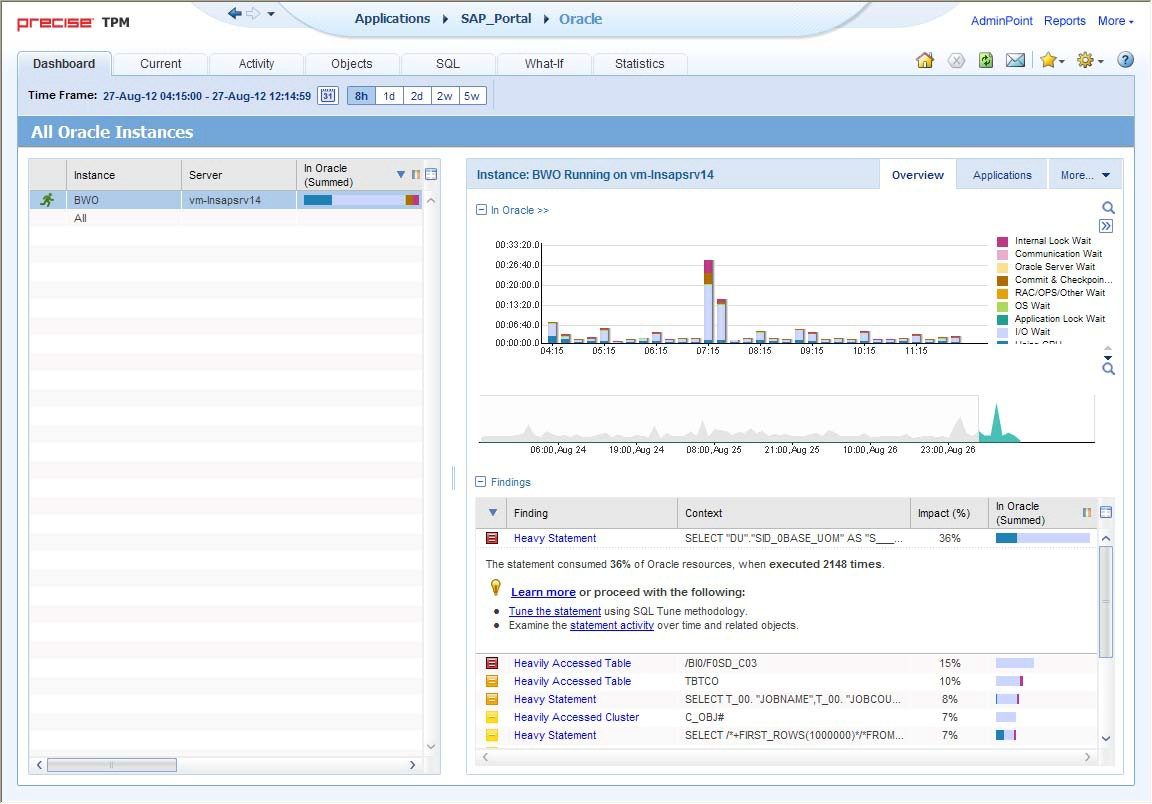
Figure 2- 1 How a typical tab is structured
About the Precise Menu Area
The Precise Menu area is the area at the top part of each Precise screen. It contains menu’s, icons, and breadcrumbs. The Precise Menu area enables you to keep track of where you have been and provides various controls.
The following table describes the function of each of the toolbar buttons.
Table 2-2 Precise bar functions
Icon Name Description
Back During
| Icon | Name | Description |
|---|---|---|
 | Back | During a work session, keeps track of where you have navigated to. The Back button enables you to navigate between previously visited views. The Back control displays your previous view. |
...
 | Forward | Enables you to navigate to the next view. This button is only enabled if you clicked Back or if you chose a history option. |
...
 | AdminPoint | Launches Precise AdminPoint. |
...
 | Home | Navigates to the highest level entity, usually the instance or Tier (all instances). The time frame settings remain the same. |
...
 | Stop | Stops a request for information from the server. |
...
 | Refresh | Updates the data currently displayed. |
...
 | Favorites | Enables you to add or remove favorites in your Favorites list. |
...
 | Send | Opens a new email message in your email program with the link to the current application in context. |
...
 | Settings | Opens the Findings Settings, General Settings, and Time Frame Settings dialog boxes. |
...
 | Help | Opens the online help in context. |
About the Main area
The Main area displays general information on the selected entity. The structure of this area depends on the selected entity and tab.
...
In some tabs, you can filter the contents of the view by clicking the Filter button. See “Filtering data” on page 29 Filtering data.
About the Association area
The Association area lists entities that have similar attributes and that are related to the selected entity named in the Tab heading. Besides the Tab bar, the Association area is the main navigation tool. It enables you to drill down from one entity to related entities (usually of a different type).
...
The Association area lets you drill down to another entity by clicking a row. The information displayed in both the Main area and the Association area will change to reflect your selection. See “Filtering data” on page 29 and “Associating Filtering data and Associating entities with data that meets specific criteria” on page 30criteria.
About the Findings area
For selected tabs in Precise products, the association area includes the Findings area, displaying problematic findings for the application. The findings feature is a high level tool, designed to provide the user with an overview of performance issues within the monitored application and enable quick and efficient navigation to the relevant tab for further analysis and handling. The displayed performance findings may indicate performance deterioration as well as incorrect methods usage. Each finding appears as a row in the displayed table of findings. Hover the mouse indicator over the single-line displayed finding to expand the finding. When expanded, the finding details area provides important guidelines as to what may be the root cause for the reported problem, and what the recommended steps are to resolve this problem.
The table below describes the information that is displayed in the Findings area.
Table 2- 3 Information displayed in the Findings area
Column Description
Severity The
| Column | Description |
|---|---|
| Severity | The severity of the finding is calculated using a formula. The position of the finding in the list is determined by an internal scoring system that is based on the knowledge of Precise product experts. The severity is indicated by the following colors: |
...
|
...
|
...
|
...
By default, findings are displayed according to severity. |
...
| Finding | A short name of the Finding. |
| Context |
...
Entity/Method name (unless specified for the whole instance). The entity/method name is a short name but the long name is displayed in the ToolTip. Some of the findings are identified in specific Methods while others are relevant for the entire instance. In the latter case, a finding is specified as an instance-related finding. |
...
| ||
| Finding |
...
| overview | Displays specific details regarding the finding in context.
|
...
| |
| Learn more (advice) |
...
Provides recommendations for solving the selected finding. For each finding, it lists all relevant pieces of advice and all applicable solutions. You should carefully review all data for the finding and then choose the advice that best suits your needs.
|
...
| |
| Proceed with the following (bullets) |
...
Provides expert knowledge about the selected finding. The information displayed will direct you if you have difficulties deciding which advice to take or which solution to implement. |
...
|
Investigating a finding
Perform the following steps to investigate a finding.
...
For more information, see “Oracle Findings” on page 183. Oracle findings.
| Anchor | ||||
|---|---|---|---|---|
|
The term '"in-context' " means that you can display additional information on a selected item by drilling down to another tab or view. The filter settings you defined (for example, the selected time frame you chose) and the entity you selected are carried over to the other view or tab, to allow you to continue analyzing your subject from a different perspective. This concept takes on slightly different meanings depending upon where you are attempting to drill down in context from.
...
In short, the information displayed when drilling down in context is always related to your original selection’s settings.
How a drill-down affects the Tab heading
The Tab heading displays the name of the currently selected entity on this screen. When you drill down to a new entity in the Association area, the Tab heading changes to reflect the name of the newly selected entity.
| Anchor | ||||
|---|---|---|---|---|
|
The following settings allow you to control the appearance and behavior of the user interface. They can be configured from the Settings menu in the Precise Menu area:
- General settings - . Includes the General, SQL, Display, Tree view, and What-If/Recommend tabs.
- Time Frame settings.
- Findings settings - . Includes the Dashboard, Activity, Objects, and SQL tabs.
| Anchor | ||||
|---|---|---|---|---|
|
On the General tab of the General Settings dialog box, you can adjust the following:
- Number of items that will be displayed for each association. From the list, select the maximum number of items that will be displayed in a table. The default is 50 items. You can control the number of items returned for a specific association by using the More... option option in the Association controls. This way, you can display up to 500 items.
- Maximum number of characters to display in a text ToolTip. When you move your cursor over text columns in a table listing Statements or PL/SQLs, a ToolTip appears, displaying more text than can normally fit into a table cell. This field controls the maximum number of characters that can be displayed. The default is 500 characters.
- How often the information in the Current tab is refreshed. If you select the Auto-refresh Current tab every check box, the Current tab automatically refreshes at the specified interval. By default, the tab is not refreshed automatically. If you select this option, the default refresh interval is every five minutes.
- Display concurrent managers history for the last x days.
- Display concurrent managers request history for the last x hours.
| Anchor | ||||
|---|---|---|---|---|
|
On the SQL tab, you can adjust the following:
- When Precise for Oracle carries out an explain plan operation, it needs to connect to the database. By default, it uses the Oracle account specified during the installation. This option lets you override the database user and password that will be used.
- Precise for Oracle's own parsing functions can be disabled at the expense of some of the formatting features of the explain plan. This option is useful when Precise for Oracle cannot parse a statement.
See “About About Precise for Oracle tabs” on page 21tabs. - You can fine-tune the way that Precise for Oracle generates alternatives to SQL in a number of ways:
- You can control the maximum number of alternative SQL statements.
- You can control the percentage of the items that are highlighted in the Oracle explain tree based on “In In Oracle Time”Time.
- You can have Precise for Oracle ignore alternatives that generate the same execution plan.
- When Precise for Oracle generates alternatives (referred to as Related SQL), any views are expanded to show the full view text, rather than just the name.
- If a Precise for Oracle view is expanded, Precise for Oracle may consider rewriting the text of the view itself, not just the statement that uses the view, when it generates alternatives.
- You can have Precise for Oracle use different Oracle Optimizer modes.
About configuring display settings
When you drill down to or choose a different entity, selecting the option on the Display tab of the General Settings dialog box allows you to maintain the selected view or tab when changing from one tab to another. This is sometimes referred to as sticky tabs.
| Anchor | ||||
|---|---|---|---|---|
|
On the Tree View tab of the General Settings dialog box, you can adjust the following:
- Display the Tree View as the default tab of the Activity tab.
- Sorting of items.
- Number of categories to display when expanding an item.
- Number of items to display when expanding a category.
About configuring What-If/Recommend settings
On the What-If/Recommend settings tab of the General Settings dialog box you can adjust the maximum number of SQL Statements shown in the What-If tab and the maximum duration of the What-If evaluation or Recommend process.
About configuring Findings settings
You can set the severity thresholds for the findings displayed in the Dashboard tab, Activity tab, SQL tab, and Objects tab, in the Findings dialog box. You determine whether a finding is to be displayed as a high, medium or low severity.
About configuring Time Frame settings
You can determine the resolution of the data that is displayed in the overtime graphs using the Time Frame Settings dialog box. By using this dialog box you can define the default time frame to display.
| Anchor | ||||
|---|---|---|---|---|
|
The following tasks are commonly performed in most tabs:
- Switching to a different tab
- Selecting a time frame
- Selecting an entity
- Filtering data
- Associating entities with data that meets specific criteria
- Focusing on information in overtime graphs
- Sending an email message
- Adding, viewing, and deleting Favorites
- Determining which table columns to display
- Copying data to the clipboard
- Exporting to the Precise Custom Portal
| Anchor | ||||
|---|---|---|---|---|
|
You can easily switch between the different tabs in the Precise Menu area. When you start your Precise product, the Dashboard tab opens by default. For other Precise products, another tab will open by default. The button of the selected tab is displayed in a darker blue.
To select a tab, click the required Tab to display information on the selected entity.
| Anchor | ||||
|---|---|---|---|---|
|
You can configure Precise for Oracle to display transaction performance data for a specific time frame using the predefined time frame options or calendar icons.
Selecting a predefined time frame from the toolbar displays transaction performance data for the selected time period up to the current time. See “Selecting Selecting a predefined time frame from the Precise for Oracle toolbar” on page 29toolbar.
Selecting the time frame using the calendar icon, you can choose to define a time range independent of the current time, or to define a time range up to the current time. See “Selecting Selecting a time frame using the calendar icon” on page 29icon.
The predefined time frame options are:
...
The time frame selected affects all information displayed in Precise for Oracle. Only data that falls within the selected time frame is shown in these areas.
| Anchor | ||||
|---|---|---|---|---|
|
To select a predefined time frame, in the Precise Menu area, select one of the predefined time frames.
| Anchor | ||||
|---|---|---|---|---|
|
To select a time frame
- Click the calendar icon. In the dialog box that is displayed perform one of the following:
- To define a time frame independent from the current time, select the ‘Time Frame’ option and Time Frame, and then select the Start and End dates and times.
- To define a time frame up to the current time, select the ‘Last’ option Last, and then enter the desired time frame.
- To use one of the three previously used time frames, select the ‘Recently used’ option and from the drop- down menu Recently used, and then select the desired time frame.
- To use a previously saved time frame, select Use a previously saved time frame and from the drop-down menu , and then select the desired time frame.
- To save your settings for future access, select Save these definitions for future use as: and and enter a name in the corresponding field.
- Click OK.
| Anchor | ||||
|---|---|---|---|---|
|
You can select the entity that you want to examine in more detail.
To select an entityOn , on the Main area of the tab, select the entity you want to examine.
| Anchor | ||||
|---|---|---|---|---|
|
You can focus on specific contents of the Dashboard and Activity workspaces by showing a subset of the information. This shows the contribution of entities such as programs and users.
...
When you apply your selections in the Filter dialog box, the information displayed in both the Main area and the Association area is modified to reflect your selections. Also, the filtering continues to apply when you drill down to associated entities.Note:
| Info |
|---|
You can enter multiple criteria, in which case each criterion is applied using the logical AND operator. |
To filter data
- Click Filter is Off/Filter is On.
- In the Filter dialog box, do the following for each entity you want to filter:
- From the left drop-down list, select an entity.
- From the middle drop-down list, select an operator, such as, Like, <>, Not Like, In, Not In.
- In the text box, type the criteria (case-sensitive) for the selected entity.
If you select the operator Like or Not Like, you can use the % wildcard character to represent 0 or more characters, and the _ wildcard character to represent exactly one character. If you select the operator In or Not In, type a comma to separate values.
- Click OK.
...
| Anchor | ||||
|---|---|---|---|---|
|
You can associate the displayed entity with specific data to focus your analysis.
| Info |
|---|
...
The criteria no longer apply when you drill down to another entity. |
To associate entities with data that meets specific criteria
- Click the arrow located to the left of the Association controls and select More...
- In the Associate With dialog box, on the Entries tab, select the entity you want to associate data with from the Populate table with list.
- In the Sort entries by list, determine according to which criteria you want the information to be sorted and in which order.
- From the Display top list, select the number of rows to display.
- On the Criteria tab, do the following for each entity you want to associate data with:
- From the left drop-down list, select an entity.
- From the middle drop-down list, select an operator, such as, Like, <>, Not Like, In, Not In.
- In the text box, type the criteria (case-sensitive) for the selected entity.
If you select the operator Like or Not Like, you can use the % wildcard character to represent 0 or more characters, and the _ wildcard character to represent exactly one character. If you select the operator In or Not In, type a comma to separate values.
- Click OK.
| Anchor | ||||
|---|---|---|---|---|
|
| Info |
|---|
...
This function is only available in Table View. |
Any statement can be saved in the PMDB. You can change the name of a statement, place it in a different cabinet and folder, change the parsing user, and add a comment. But you cannot save a statement with the same combination of cabinet, folder, and name as an existing statement.
...
To edit the properties of a statement
- Click the Actions icon>Edit icon > Edit Properties.
- In the Edit Statement Properties dialog box, choose the relevant properties for the statement from the drop-down lists and enter a statement name.
The following properties are available:- Instance. Name of the instance that the statement belongs to. The instance cannot be changed.
- Parsing User. Choose an Oracle user name that will parse the statement from the drop-down list.
- Cabinet. Choose a cabinet to save the statement in, from the drop-down list or type in a name.
- Folder. Choose a folder to save the statement in, from the drop-down list or type in a name.
- Statement. Type a user-defined name for the statement.
- Comment. Type an optional tuning comment that is to be associated with the statement.
- Click OK.
| Anchor | ||||
|---|---|---|---|---|
|
Some entities display an overtime graph. The overtime graph displays entity statistics over a specified time period. Depending on the number of points displayed in the graph, you may need to zoom in or out. The text displayed on the x-axis varies according to the time frame. If there is a year or day change, x-axis labels will display accordingly.
To focus on information in overtime graphs, select the desired time frame on the overtime graph, click and drag the left or right handle to increase or decrease the time range. The small zoom (spyglass) icon will display on the upper right of the selected time range, and above the overtime graph legend. Click the zoom icon to zoom in according to the selected time frame.
| Anchor | ||||
|---|---|---|---|---|
|
You can send an email message to one or more recipients from the Precise toolbar. The default subject for the message will be “Link is, "Link to a Precise application”application."
The email will include a link to the Precise product in the current context (time frame and selected entries). To send an email message
- Click the email icon in the Precise Menu area. The default email program opens.
- Fill in the required fields and click Send.
| Anchor | ||||
|---|---|---|---|---|
|
The Favorites feature allows you to save a specific location in your application and to retrieve the same location later without having to navigate to it.
About the Favorites feature
The new Favorites feature includes the following options:
- Relative Time Frame. Saving relative time frame instead of static date. For example, saving the last 7 seven days will always display the last 7 seven days, depending on the day entered.
- One click to specific location. Once you open Precise by launching a saved Favorite item, you will not have to enter a login credential nor click the login button.
- IE Favorites support. Adding a new Favorite item in Precise will also add it to the IE Favorites menu.
- Auto Complete. The Favorites dialog includes a new combo box which supports AutoComplete.
- Auto Naming. The Favorites dialog generates item names based on the current location.
UI description
A Favorites icon with a menu has been added to the Precise Menu area in each product.
...
- In the Add/Delete Favorites dialog box, enter the name of the new Favorites entry.
- Click Add. The dialog box is closed and the new Favorite is added to the list.
...
- On the Add/Delete Favorites dialog box, select the Favorite location to be deleted.
- Click Delete. The dialog box closes and the selected Favorite is deleted from the list.
| Info |
|---|
...
The favorite address is displayed in the Address field and cannot be edited. |
| Anchor | ||||
|---|---|---|---|---|
|
Tables are used to display information about a set of related entities in the Main and Association areas. It is possible to determine which columns to display in the Association area tables.
...
- Click the Table icon on the upper right-hand side of a table and select Column Chooser.
- In the Table columns dialog box, click the arrows to move the names of the columns that you want to display to the Visible box and the ones that you do not want to display to the Invisible box.
- Click OK.
| Anchor | ||||
|---|---|---|---|---|
|
At times you may want to save data displayed in the table area in a Microsoft Excel spreadsheet for further analysis or save an image of a graph to the clipboard.
To copy data displayed in the Association area to the clipboard, click the Table icon on the upper right-hand side of a table and select Copy to clipboard. The table can be pasted into Microsoft Excel or as an HTML file.
To copy a graph to the clipboard, right-click a graph and choose Copy to clipboard. You can now paste the image into any application that works with the clipboard.
| Anchor | ||||
|---|---|---|---|---|
|
The Export to the Precise Custom Portal Portlet feature enables you to export the view of the chosen table or graph and generate a portlet with that view in the Precise Custom Portal, so that it will provide you with another way of monitoring your application.
Prerequisites
To be able to use this feature, you need to have the following rights in Precise:
...
If you do not have sufficient rights, you will get an error message when trying to execute this feature.
Exporting the information
You can either export a table view or a graph view.
| Info |
|---|
...
The name field has the following restrictions: maximum 100 characters. |
To export a table view
- Click the Column Chooser icon.
- Select Export to the Precise Custom Portal Portlet.
- Insert a name in the name field that clearly describes the table view.
- Click OK.
To export a graph view
- Right-click the graph.
- Select Export to the Precise Custom Portal Portlet.
- Insert a name in the name field that clearly describes the graph view.
- Click OK.
| Anchor | ||||
|---|---|---|---|---|
|
The Roles management feature in Precise for Oracle lets you assign roles to users and control whether they will be able to do the following operations:
- Bind. View bind sets.
- Run alternative. Run an alternative statement.
- Gen_Estimated_Plan. Determine whether viewing existing or real plans collected from Oracle will always be allowed.
- Gen_Massive_Plan. Explain unexplained statements in the Object tuner (depends on what is configured for Gen_Estimated_Plan).
- Whatif. Lets you simulate the effect of creating, modifying, or dropping a B*Tree or bitmap index, on the performance of all statements that Precise for Oracle has collected, without having to physically make the change (depends on what is configured for Gen_Estimated_Plan).
...
You can configure permissions and roles in AdminPoint. For more information on configuring permissions and roles see the Precise Administration Guide.
| Anchor | ||||
|---|---|---|---|---|
|
Precise for Oracle collects and displays performance data that enables quick and accurate performance monitoring and analysis. To understand the information displayed in the various graphs, tables, and views, it is important to understand how information is collected.
Precise for Oracle Collector sampling methods
The Precise for Oracle Collector is a non-Oracle process that can collect data from both the server's operating system and the Oracle instance. This is important because both the server's operating system and the Oracle instance contain data necessary for the solution of a performance problem, but neither is aware of the other's internal state.
...
- It must be able to collect data from both the server’s operating system and the Oracle database system.
- It must be fully independent of the Oracle system that it monitors to provide a true picture of Oracle activity.
- It must be able to achieve high sampling rates.
Precise for Oracle meets all of these criteria.
Non-intrusive monitoring of the Oracle instance
Most monitors collect data on user activity and system status intrusively by issuing queries to the Oracle X$ and V$ dynamic performance views. These queries consume Oracle resources and tend to be neglected by Oracle when system load is heavy and collecting data on Oracle is most important.
Precise for Oracle's Collector gathers data non-intrusively by sampling data in the System Global Area (SGA) of the Oracle instance. This makes monitoring the Oracle instance independent of the Oracle system.
| Anchor | ||||
|---|---|---|---|---|
|
The Precise for Oracle Collector monitors the Oracle instance. If the instance status (Available/Unavailable) has changed, a message code is sent by the Collector and causes the current availability of the instance saved in the PMDB to be changed. In addition, the availability of the instance is saved, over time, in the PMDB. During a planned downtime period, the instance availability is shown as it was available during this period.Note:
| Info |
|---|
If the Precise for Oracle Collector is down, the instance availability status reported is as Unknown. |
High sampling rates
The Collector can be configured to sample data using a high sampling rate. This enables the Collector to collect data on entities that are executed for only very short periods of time.
High resource consumption can be the result of an entity (such as a program or statement) with heavy resource demands running for an extended period of time (long duration, low frequency). It can also be the result of an entity with modest resource demands running often for a short period of time (short duration, high frequency). Identifying the latter entity as the cause of a performance problem can be difficult if the Oracle instance is sampled using a low sampling rate. If execution duration is short enough, complete executions of the problematic entity can take place between samples, and data on these executions will not be included in the overall picture of system performance.Wait
| Anchor | ||||
|---|---|---|---|---|
|
Fundamental to the operation of Precise for Oracle is the capturing of wait state information to identify resource consumption. The Precise for Oracle Collector, using its unique collection technology, samples every Oracle session and SQL statement, and at each sample point determines the Oracle wait event. It also correlates the session information with the corresponding operating system process information to capture additional wait states. In fact, it employs a two-Tier categorization: wait state and wait sub-state. It defines the status of sessions currently connected to Oracle by these states. By aggregating this wait state information over time, Precise for Oracle can give an accurate time-based, resource consumption profile for every statement, table, session, program, and so on, up to the instance level.
...
Precise for Oracle displays the following resource consumption graphs:
| Anchor | ||||
|---|---|---|---|---|
|
The Overall Activity resource consumption graphs give the total time that a session or a set of sessions is connected to Oracle. During that time, the session may be actively executing statements within Oracle, or it may be idle. Overall Activity can help answer the question: Is the application spending its time in Oracle or elsewhere?
Overall Activity is divided into the following states:
- Request Wait. The session is idle. The underlying Oracle wait state is typically an SQL*Net message from the client or pipe_get, and the client is performance-related and not Oracle-related activity.
- In Oracle (Sum.). The total time sessions spent actively executing statements and PL/SQL within Oracle. This is further broken down into In Oracle states in the In Oracle resource consumption graphs.
- Parallel Query Sync. The time that a parallel query coordinator and parallel query slave sessions spent waiting for other slaves to complete an operation. It is not shown as time spent actively executing In Oracle because the parallel query sessions are effectively idle during this time.
- Miscellaneous. The time not accounted for by one of the other states. It is usually due to session initialization or termination. For example, a dead session not yet cleaned up by Oracle PMON may have some time in this state.
| Anchor | ||||
|---|---|---|---|---|
|
The In Oracle resource consumption graphs give a breakdown of how Oracle is spending its time executing statements and PL/SQL. The wait states with the longest duration indicate the bottlenecks within Oracle. Reducing the duration of these wait states will improve the response time or alternatively increase the throughput.
...
The following table lists the existing In Oracle states.
Table 2- 4 In Oracle states
| In Oracle |
|---|
...
| State | Icon | In Oracle Sub-State | Description | Typical Oracle Events |
|---|---|---|---|---|
| Using |
...
| CPU |  | Using CPU | The session is using CPU |
...
| executing SQL. |
...
| N/A | |
| I/O |
...
| Wait |  | Direct I/O |
...
| Wait | The session is waiting on direct |
...
| I/O. |
...
| direct path read; direct path write | |
| I/O |
...
| Wait | |
...
| Scattered I/O |
...
| Wait | The session is waiting on scattered I/O. |
...
| db file scattered read | |
| I/O |
...
| Wait | | Sequential I/O |
...
| Wait | The session is waiting on sequential I/O. |
...
| db file sequential read; |
...
| control file sequential read |
| I/O |
...
| Wait | | Other I/O |
...
| Wait | The session is waiting on another type of I/O. |
...
| db file parallel write; log file parallel write; control file parallel write; asynch disk I/O | |
| I/O |
...
| Wait | |
|
...
|
...
| Application Lock |
...
| Wait |  |
...
| Row Lock Wait | The session is waiting on row locks. |
...
| Enq: TX - row lock contention (Oracle 10g) | |
| Application Lock |
...
| Wait |  | Table Lock |
...
| Wait | The session is waiting on table locks. |
...
| Enq: TM - contention (Oracle |
...
| 10g) |
| Internal Lock |
...
| Wait |  |
...
| Other Lock |
...
| Wait | The session is waiting on other Oracle locks, such as streams, latches, or internal locks. |
...
| STREAMS events; enqueue; other enq: events; latch activity; latch free; latch: events |
...
| Application Lock |
...
| Wait | |
|
...
| ||
| Operating System Waits |
...
 |
...
| CPU |
...
| Wait | The session is |
...
| in the operating system |
...
| queue waiting for CPU. |
...
| N/A | |
| Operating System |
...
| Waits |  | Memory Wait | The session is waiting on a memory operation, such as page-in or page-out. This sub-state may also include memory-mapped I/O. |
...
| N/A | |
| Operating System Waits |
...
 |
...
| Other Host |
...
| Wait | The session is waiting on another type of OS operation, such as sorting. |
...
| N/A | |
| RAC/OPS/ Other |
...
| Waits |  | RAC/OPS |
...
| Wait | The session is waiting on RAC or |
...
| OPS synchronization. |
...
| DFS events; DLM events; gc events; gcs events; ges events; global events |
...
| RAC/OPS/ Other |
...
| Waits |  |
...
| Other |
...
| Wait | The session is waiting on another, less common lock event. |
...
| N/A | |
| Commit & Checkpoint |
...
| Waits |  | Rollback Segment Wait | The session is waiting on a rollback segment operation. |
...
| alter rbs offline; undo segment events | |
| Commit & Checkpoint Waits |
...
 |
...
| Redo Log Buffer |
...
| Wait | The session is waiting on a redo log buffer operation. |
...
| log buffer space; log file syn | |
| Commit & Checkpoint |
...
| Waits |  | Log Switch and Clear Wait |
...
| The session is waiting for a log switch and clear operation to occur. |
...
| checkpoint events; log file switch events | |
| Oracle Server |
...
| Wait |  |
...
| Parallel Query Server Wait |
...
| The session is waiting for a parallel query server to become available. |
...
| PX create server; PX server shutdown; parallel query; create server; parallel query; dequeue wait | |
| Oracle Server |
...
| Wait |  | Parallel Query Sync. |
...
| Wait | The session is waiting for a parallel query server to get synchronized with another parallel query server. |
...
| Other PX events; other parallel query events |
...
| Oracle Server Wait |  | Resource Manager Wait | The session is waiting for a resource to become available (only if the database resource manager is enabled). |
...
| resmgr events | |
| Oracle Server |
...
| Wait |  | Multi-Threaded Server Wait |
...
The session is waiting for a |
...
multi-threaded server to become available. |
...
| alter system set dispatcher; alter system set mts_dispatcher | |
| Oracle Server |
...
| Wait |  |
...
| Background Process Wait |
...
| The session is waiting for an Oracle background process, such as DBWR or LGWR. |
...
| LGWR events | |
| Client Request |
...
| Wait |  | Request wait | Request wait is generally considered as an idle event as the Oracle server process is waiting for the client process. |
...
| Client messages | |
| Communication |
...
| Wait |  |
...
| Oracle/Oracle Communication Wait |
...
| The session is waiting for another Oracle instance, usually as a result of a DBLINK event or a standby database. |
...
SQL*Net break/reset to DBLINK; SQL*Net message from DBLINK; SQL*Net message to DBLINK; SQL*Net more data from DBLINK; SQL*Net more |
...
data to DBLINK |
| Communication |
...
| Wait |  | Oracle/Client Communication Wait |
...
| The session is waiting for data sent to the client, usually as a result of a selected statement, or for data sent from a client, usually as a result of bind variables. |
...
| SQL*Net break/reset to client; SQL*Net message to client; SQL*Net more data from client; SQL*Net more data to client | |
| Internal Lock |
...
| Wait |  |
...
| Shared Pool |
...
| Wait | The session is waiting for a shared pool operation. |
...
| library cache load lock; library cache lock; library cache pin | |
| Internal Lock |
...
| Wait |  | Buffer Wait | The session is waiting for a buffer cache operation. |
...
buffer busy; buffer busy wait; |
...
buffer latch |
| Anchor | ||||
|---|---|---|---|---|
|
I/O Wait resource consumption graphs are shown for Oracle files, objects, and storage entities. They give a breakdown of the following I/O wait into:
...
The other In Oracle wait states, such as Using CPU, do not apply to an object. See “In Oracle” on page 36. Wait States - In Oracle.
| Anchor | ||||
|---|---|---|---|---|
|
SQL statements in Precise for Oracle are assigned a numeric identifier (a 20-digit number that is divided into 4 four sections, with dot separators) or a user-defined name. The numeric identifier is similar to, but not the same as, the hash value that Oracle assigns to a SQL statement. When Precise for Oracle calculates the numeric identifier, it ignores white space and case, unlike Oracle. It also takes into account whether Collapse Statements is switched on, in which case string literals are replaced with place holders or pseudo-bind variables.
| Anchor | ||||
|---|---|---|---|---|
|
Precise for Oracle employs the following methods to determine how many times a statement has been executed.
At each sample point, the Precise for Oracle Collector examines the equivalent area of the SGA that V$SQL maps on to and captures the number of executions of the statement that Oracle has recorded. (It also captures buffer gets and rows processed.
Note:Info Precise for Oracle only increments the counters when the statement has finished executing similar to V$SQL.
- At each sample point, the Precise for Oracle Collector examines whether the session is opening or fetching from a cursor, that is executing a statement. Oracle does not provide enough information to allow the Collector to determine whether the session is opening (executing) the statement or fetching results, and therefore it counts both. This potential over-reading of the actual execution count may be offset by the fact that any sampling technology may miss some executions, particularly for fast-running statements.
Where possible, Precise for Oracle displays the number of executions that Oracle has recorded because it is more accurate. However, V$SQL only contains statistics about the statement; it does not tell you which session ran it. Therefore, it is not possible to accurately divide the number of executions between the sessions. This means that in the user interface, wherever you drill down in the context of a session (and this includes program and user), you will see opens and fetches. Where you drill down directly from the instance level to a statement, you will see executions. The Current tab, for example, displays opens and fetches because you always view a statement in the context of a session, whereas the Activity tab may display either executions or opens and fetches, depending on your navigation path. Other derived values, such as average response time, are only shown if the number of executions is available.
In Oracle time vs. Duration time
In Oracle time indicates the period that the entity consumed within the monitored box, not including IDLE time (sleep, waiting for user requests, etc.).
Duration time is the "wall clock time," , including idle and non-idle consumption periods. The following calculations are used:
Table 2- 5 Calculations
| Calculations |
|---|
...
| Description |
|---|
In Oracle time (Avg.) |
...
| In Oracle time divided by the amount of executions. | |
| Duration time (Avg.) |
...
| Duration time divided by the amount of executions or sessions (the parameter depends on the entity that is used). |
The following is an explanation based on an example statement using a parallel query.:
When a session runs a statement for a table with parallel degree of n (4 degrees for example), the Oracle engine creates n new sessions to serve it (these sessions are called: "Parallel Server Agents"). Each of the parallel server agents runs as an individual entity and analyzes part of the requested data, while the original session (the one that you logged in with) is called the coordinator session. The last goal is to receive all the information from the parallel server agents and summarize (sort/filter/calculate/join) it. Usually the coordinator session will not perform an "In Oracle" operation. In fact it is waiting "All the time" when the parallel server agents are working. These parallel server agents can perform I/O / Locks / RAC operations - like any other regular session. These sessions (4 in our example) have the same session identifiers as the coordinator session. Therefore in the collector's aggregation phase all the sessions are aggregate into one row. For example, if a specific statement runs for 1 hour (wall clock time) you can see in the Activity tab that the statement consumed 4 hours "In Oracle" time. You can also find the parallel degree of the statement within the Activity tab.
| Anchor | ||||
|---|---|---|---|---|
|
Precise for Oracle captures standard Oracle statistics that you can see in the V$SESSTAT table. However, the Collector reads the values in a low-overhead fashion directly from the SGA memory that the V$ tables map onto. Where necessary, the statistics are divided between the sessions executing each SQL statement and then aggregated to the user, program, and instance levels. You will see these statistics in the Current and Activity tabs, displayed as name-value pairs. Each statistic represents a different counter and has its own units. See Oracle’s documentation for more information on these statistics.
| Anchor | ||||
|---|---|---|---|---|
|
Precise Interpoint is the only tool that helps the ERP administrator identify the exact cause of problems in ERP applications.
...
The following table shows how Precise Interpoint maps the entities in each ERP application. You can find information about how to install Oracle Applications, SAP, PeopleSoft, and Siebel Tier Collectors in the Precise Installation Guideand Administration.
Table 2- 6 Mapping of Precise Interpoint entities per technology
| Technology |
|---|
...
| Entity without Interpoint Installed |
|---|
...
| Entity with Interpoint Installed |
|---|
| Oracle |
...
| Applications | User | User |
| Oracle Applications | Program | Form |
| Oracle Applications | Module | Application |
| Oracle Applications | Action | Request |
| Oracle Applications | Work Type: OA Batch, OA Interactive, OA Self-Service, OA CRM, or Other |
...
| SAP | User | User |
| SAP | Program | SAP Transaction |
| SAP | Module | Function |
| SAP | Action | Screen |
| SAP | Work Type: SAP Dialog, SAP Batch, SAP Spool, or SAP Lock/Enqueue |
...
PeopleSoft | User | User |
| PeopleSoft | Machine | Machine |
| PeopleSoft | Work Type: PS Interactive, PS Batch, or Other |
...
| Siebel | Program | Siebel Views |
| Siebel | Module | Siebel Business Objects |
| Siebel | Action | Siebel Applications |
| Siebel | Work Type: Interactive, Task Batch, Task Background, or |
...
Task Interactive |
| Anchor | ||||
|---|---|---|---|---|
|
Precise for Storage, Oracle version supports EMC Symmetrix and Clariion, and Hitachi HDS. It offers a unique method to identify I/O problems in your attached storage and reports I/O wait time instead of just I/O counters. This lets you easily identify the resource that is actually being waited for and tune it instead of guessing by rules of thumb. Furthermore, you can associate the storage device with the applications and statements that are waiting on I/O.
...
Performance problems caused by high I/O wait time may be tuned on the following levels:
- Oracle files. After finding Oracle files for which I/O wait time is high, you can improve I/O wait time using different techniques. For example, you can partition a table residing in the file, separate tables residing in the file into different files, or decrease the number of extents making up the file.
- Devices. After finding devices for which I/O wait time is high, you can improve I/O wait time using different techniques. For example, you can move a heavily used Oracle file to a less active device, change the configuration, and relocate devices with high waiting time to different physical devices or balance the volume of the disk directors.
It is important to understand how Precise for Oracle can aid you with this latter activity. Precise for Oracle provides two different views of device performance. The Activity tab shows the time waited on devices used by the currently selected instance: you use this tab to find the performance bottlenecks within your application. The Objects tab shows performance counters for all devices, not just those used by the current instance. This gives you a view of the overall performance of the storage arrays and lets you choose less busy devices to move your Oracle files to.
| Anchor | ||||
|---|---|---|---|---|
|
Precise is a Web-based application. You can access the Precise user interface using the Internet Explorer browser, version 6.0 or later. The syntax of the Precise URL address is: http://<server>:<port>, where <server> refers to the Precise FocalPoint server and <port> refers to the port number used by the GUI Web server. By default, the port number is 20790 (20760 for J2EE). For example: http://beanotown:20790.
This URL provides secure access to the StartPoint using authorized roles. From here, you can launch all Precise products. It gives you a quick overview of the status of your applications and access to the AdminPoint, where you can perform various management tasks (see the Precise Administration Guide for details).Note:
| Info |
|---|
You must have local administrator privileges on the server where the StartPoint is running. |
To launch your product using Precise StartPoint
- Type the address of the StartPoint user interface into the Address bar of your browser and click Enter. The Precise login page opens. The login page provides secure access to Precise and to your specific product.
- Specify your authorized role name and password. By default, both role name and password are
admin. For more information about role names, see the Precise Administration Guidesee Installation and Administration. - Click Login. The StartPoint page opens. This is the Precise home page.
- On the Product Selection bar, from the drop-down list, select the product you want to launch.
Precise. Performance intelligence from click to storage. Learn more > >
...
...