Page History
...
Table 2-1 Tabs in Precise for OracleTab Description
Dashboard Lets
| Tab | Description |
|---|---|
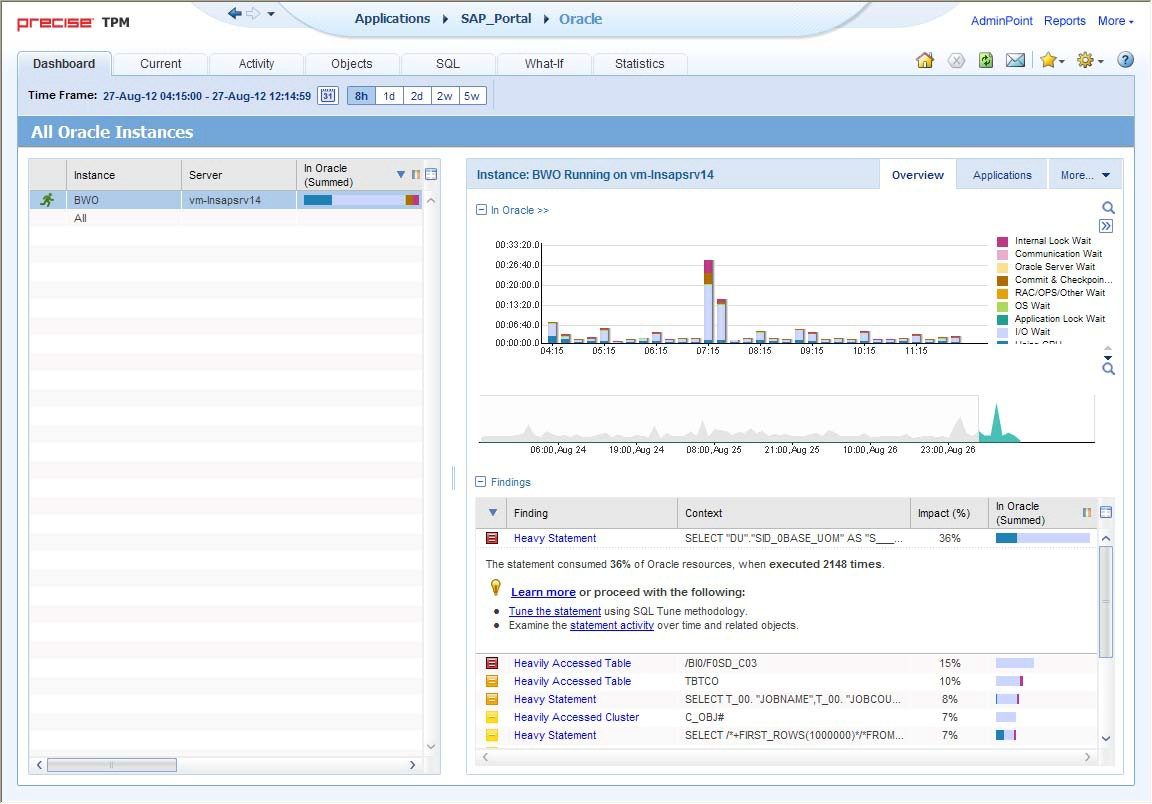
| Dashboard | Lets you quickly identify which Oracle instance has a performance problem, providing the first glimpse into where the problem lies. The Dashboard tab also lets you compare performance and statistics among your Oracle instances. |
...
| Current | Lets you identify and solve the performance problems that are happening now. |
| Activity |
...
| Lets you examine the application's performance over time and helps locate performance bottlenecks in its behavior. |
| Objects |
...
| Lets you browse Oracle database objects. It can help you understand the relationships and associations between database schema objects and the SQL statements that access them. It is primarily used for object tuning. |
...
| SQL | Lets you tune problematic SQL statements. |
| What- |
...
| If | Lets you simulate the effect of any index change on SQL statements running in your application. |
| Statistics |
...
| Lets you examine Oracle's own statistics and see graphs of their variation over time. It is primarily used for instance tuning. |
| Oracle |
...
| Applications | Lets you identify problems in Oracle Applications concurrent managers and requests. Note that this tab is only available if you have Interpoint for Oracle Applications installed. |
| Anchor | ||||
|---|---|---|---|---|
|
...
You can control the tab by doing any of the following:
- Keeping the selected entity but changing the associated entities—by entities. By selecting a different entity from the Association controls in the Association area.
- Changing the selected entity—by entity. By selecting a row in the Association area.
- Changing the view for the selected entity—by entity. By selecting a different view in the Main area.
...
Figure 2-1 How a typical tab is structured
About the Precise Menu Area
The Precise Menu area is the area at the top part of each Precise screen. It contains menu’s, icons, and breadcrumbs. The Precise Menu area enables you to keep track of where you have been and provides various controls.
...
Table 2-2 Precise bar functions
Icon Name Description
Back During
| Icon | Name | Description |
|---|---|---|
 | Back | During a work session, keeps track of where you have navigated to. The Back button enables you to navigate between previously visited views. The Back control displays your previous view. |
...
 | Forward | Enables you to navigate to the next view. This button is only enabled if you clicked Back or if you chose a history option. |
...
 | AdminPoint | Launches Precise AdminPoint. |
...
 | Home | Navigates to the highest level entity, usually the instance or Tier (all instances). The time frame settings remain the same. |
...
 | Stop | Stops a request for information from the server. |
...
 | Refresh | Updates the data currently displayed. |
...
 | Favorites | Enables you to add or remove favorites in your Favorites list. |
...
 | Send | Opens a new email message in your email program with the link to the current application in context. |
...
 | Settings | Opens the Findings Settings, General Settings, and Time Frame Settings dialog boxes. |
...
 | Help | Opens the online help in context. |
About the Main area
The Main area displays general information on the selected entity. The structure of this area depends on the selected entity and tab.
...
In some tabs, you can filter the contents of the view by clicking the Filter button. See “Filtering data” on page 29.
About the Association area
The Association area lists entities that have similar attributes and that are related to the selected entity named in the Tab heading. Besides the Tab bar, the Association area is the main navigation tool. It enables you to drill down from one entity to related entities (usually of a different type).
...
The Association area lets you drill down to another entity by clicking a row. The information displayed in both the Main area and the Association area will change to reflect your selection. See “Filtering data” on page 29 and “Associating entities with data that meets specific criteria” on page 30.
About the Findings area
For selected tabs in Precise products, the association area includes the Findings area, displaying problematic findings for the application. The findings feature is a high level tool, designed to provide the user with an overview of performance issues within the monitored application and enable quick and efficient navigation to the relevant tab for further analysis and handling. The displayed performance findings may indicate performance deterioration as well as incorrect methods usage. Each finding appears as a row in the displayed table of findings. Hover the mouse indicator over the single-line displayed finding to expand the finding. When expanded, the finding details area provides important guidelines as to what may be the root cause for the reported problem, and what the recommended steps are to resolve this problem.
...
Table 2-3 Information displayed in the Findings area
Column Description
Severity The
| Column | Description |
|---|---|
| Severity | The severity of the finding is calculated using a formula. The position of the finding in the list is determined by an internal scoring system that is based on the knowledge of Precise product experts. The severity is indicated by the following colors: |
...
|
...
|
...
|
...
By default, findings are displayed according to severity. |
| Finding |
...
| A short name of the Finding. |
...
| Context | Entity/Method name (unless specified for the whole instance). The entity/method name is a short name but the long name is displayed in the ToolTip. Some of the findings are identified in specific Methods while others are relevant for the entire instance. In the latter case, a finding is specified as an instance-related finding. |
...
| ||
| Finding |
...
| overview | Displays specific details regarding the finding in context.
|
...
| |
| Learn more (advice) |
...
Provides recommendations for solving the selected finding. For each finding, it lists all relevant pieces of advice and all applicable solutions. You should carefully review all data for the finding and then choose the advice that best suits your needs.
|
...
| |
| Proceed with the following (bullets) |
...
Provides expert knowledge about the selected finding. The information displayed will direct you if you have difficulties deciding which advice to take or which solution to implement. |
...
|
Investigating a finding
Perform the following steps to investigate a finding.
...
In short, the information displayed when drilling down in context is always related to your original selection’s settings.
How a drill-down affects the Tab heading
The Tab heading displays the name of the currently selected entity on this screen. When you drill down to a new entity in the Association area, the Tab heading changes to reflect the name of the newly selected entity.
...
The following settings allow you to control the appearance and behavior of the user interface. They can be configured from the Settings menu in the Precise Menu area:
- General settings - . Includes the General, SQL, Display, Tree view, and What-If/Recommend tabs.
- Time Frame settings.
- Findings settings - . Includes the Dashboard, Activity, Objects, and SQL tabs.
About configuring general settings
On the General tab of the General Settings dialog box, you can adjust the following:
- Number of items that will be displayed for each association. From the list, select the maximum number of items that will be displayed in a table. The default is 50 items. You can control the number of items returned for a specific association by using the More... option in the Association controls. This way, you can display up to 500 items.
- Maximum number of characters to display in a text ToolTip. When you move your cursor over text columns in a table listing Statements or PL/SQLs, a ToolTip appears, displaying more text than can normally fit into a table cell. This field controls the maximum number of characters that can be displayed. The default is 500 characters.
- How often the information in the Current tab is refreshed. If you select the Auto-refresh Current tab every check box, the Current tab automatically refreshes at the specified interval. By default, the tab is not refreshed automatically. If you select this option, the default refresh interval is every five minutes.
- Display concurrent managers history for the last x days.
- Display concurrent managers request history for the last x hours.
About SQL settings
On the SQL tab, you can adjust the following:
- When Precise for Oracle carries out an explain plan operation, it needs to connect to the database. By default, it uses the Oracle account specified during the installation. This option lets you override the database user and password that will be used.
- Precise for Oracle's own parsing functions can be disabled at the expense of some of the formatting features of the explain plan. This option is useful when Precise for Oracle cannot parse a statement.
See “About Precise for Oracle tabs” on page 21. - You can fine-tune the way that Precise for Oracle generates alternatives to SQL in a number of ways:
- You can control the maximum number of alternative SQL statements.
- You can control the percentage of the items that are highlighted in the Oracle explain tree based on “In Oracle Time”.
- You can have Precise for Oracle ignore alternatives that generate the same execution plan.
- When Precise for Oracle generates alternatives (referred to as Related SQL), any views are expanded to show the full view text, rather than just the name.
- If a Precise for Oracle view is expanded, Precise for Oracle may consider rewriting the text of the view itself, not just the statement that uses the view, when it generates alternatives.
- You can have Precise for Oracle use different Oracle Optimizer modes.
About configuring display settings
When you drill down to or choose a different entity, selecting the option on the Display tab of the General Settings dialog box allows you to maintain the selected view or tab when changing from one tab to another. This is sometimes referred to as sticky tabs.
About configuring Tree view settings (Only applies to Precise products that include a Tree view)
On the Tree View tab of the General Settings dialog box, you can adjust the following:
- Display the Tree View as the default tab of the Activity tab.
- Sorting of items.
- Number of categories to display when expanding an item.
- Number of items to display when expanding a category.
About configuring What-If/Recommend settings
On the What-If/Recommend settings tab of the General Settings dialog box you can adjust the maximum number of SQL Statements shown in the What-If tab and the maximum duration of the What-If evaluation or Recommend process.
About configuring Findings settings
You can set the severity thresholds for the findings displayed in the Dashboard tab, Activity tab, SQL tab, and Objects tab, in the Findings dialog box. You determine whether a finding is to be displayed as a high, medium or low severity.
About configuring Time Frame settings
You can determine the resolution of the data that is displayed in the overtime graphs using the Time Frame Settings dialog box. By using this dialog box you can define the default time frame to display.
...