Page History
...
Figure 2-1 Typical Precise for SAP tab structure
Tab heading
Precise bar Tab Selection bar
Main area
Association area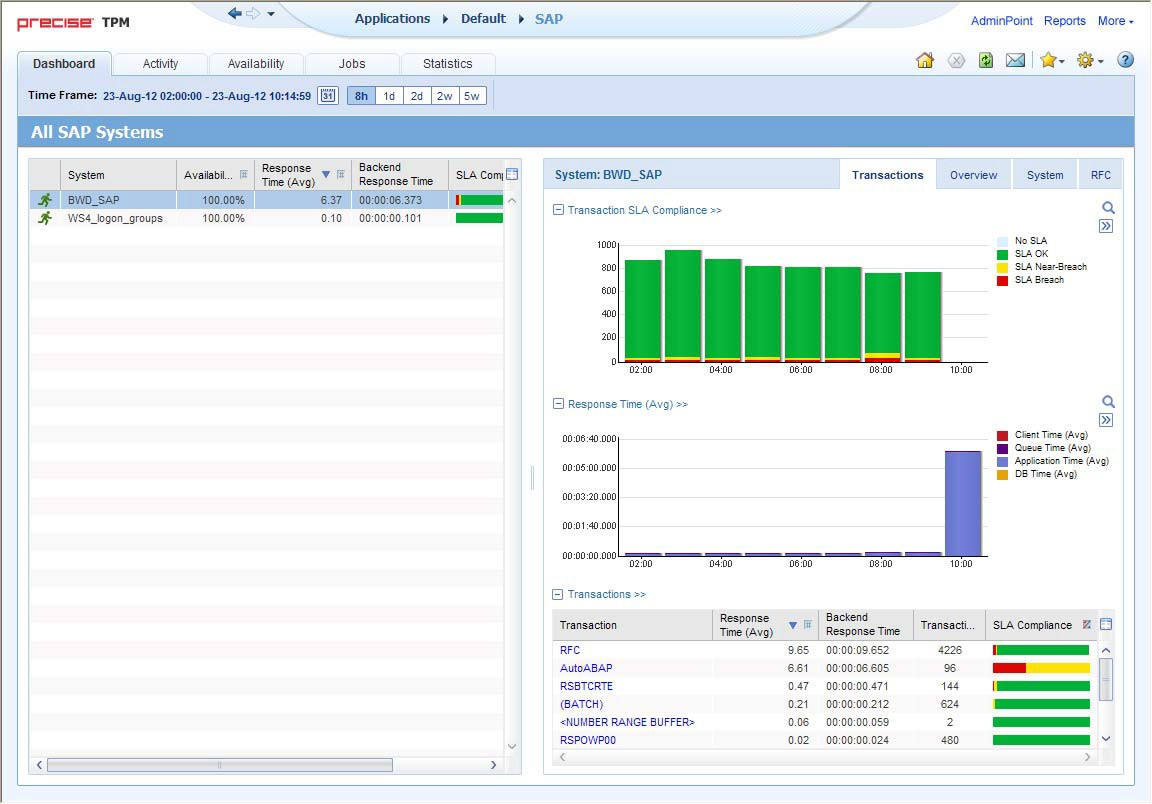
About the Precise bar
The Precise bar enables you to keep track of where you have been and provides various controls. The following table describes the function of each of the toolbar buttons.
Table 2-2 Precise bar functionsButton Name Description
Back During
| Button | Name | Description |
|---|---|---|
 | Back | During a work session, keeps track of where you have navigated to. The Back button enables you to navigate between previously visited views. The Back control displays your previous view. |
...
 | Forward | Enables you to navigate to the next view. This button is only enabled if you clicked |
...
| Back or if you chose a history option. |
...
 | Stop | Stops a request for information from the server. |
...
 | Refresh | Updates the data currently displayed. |
...
 | Favorites | Enables you to add or remove favorites in your Favorites list. |
...
 | Send | Opens a new email message in your email program with the link to the current application in context. |
...
 | Home | Navigates to the highest level entity (stays in the same Tier, tab, or view). The time frame settings remain the same. |
...
 | Help | Opens the online help in context. |
...
 | Settings | Lets you configure various program settings. |
...
 | AdminPoint | Launches Precise AdminPoint. |
About the Main area
The Main area displays general information on the selected instance or entity, in context (the entity that is described in the Tab Heading). The structure of this area depends on the selected entity and tab. For example, some views show two overtime graphs, displayed side-by-side, describing two data series.
The View Control drop-down menu allows you to choose different view options. You can access this menu by clicking the arrow icon.
In some tabs, you can filter the contents of the view by clicking the Filter button. See “Filtering data” on page 19.
About the Association area
The Association area lists entities that have similar attributes, and that are related to the selected entity named in the Tab heading. Besides the Tab bar, the Association area is the main navigation tool. It enables you to drill down from one entity to related entities (usually of a different type).
The entities displayed in this area depend on the selected tab and the selected entity. The same entity may be displayed in several tabs, with different data displayed for each one. For example, it is possible to view performance information on Application servers, transactions, etc., in the Activity tab, while in the Availability tab it is only possible to view information on entities that have availability data collected for them, such as Application Servers.
The Association control, accessed by the arrow icon, allows you to associate with different entities. The last option, More..., opens a dialog box that lets you carry out additional operations, such as to view additional associations, change the sort order, or control the number of returned rows.
The information displayed in the Association area is arranged in a tabular format. Each row in the table represents an entity, and each column describes an attribute of the entity, such as text or a graph. It is possible to change the sort order of the entities in the table by clicking a column title.
The Association tabs located above the table let you display different sets of attributes for the entities displayed in the table. The Association tabs are entity-dependent. For some entities, no tabs are displayed. Selecting a tab does not change the list of entities displayed in the table—it only changes which attributes are displayed.
A numeric column can optionally display a graph, and at times, it can display a stacked bar graph as well (where the combined length corresponds to the numeric value of the column). Switching to a graph view in these columns, offers some level of breakdown to the information displayed in the column.
The following icons are used to indicate which format information is displayed.
Table 2-3 Changing the format in which information is displayedIcon Description
Display
| Icon | Description |
|---|---|
 | Display the information in numerical format. |
 |
...
| Display the information in a bar graph. |
...
 | Display the information as a stacked bar graph. |
 |
...
| Display the information in percentage format. |
The Association area lets you drill down to another entity by clicking a row. The information displayed in both the Main area and the Association area will change to reflect your selection.
See “Filtering data” on page 19 .
See and “Associating entities with data that meets specific criteria” on page 19.
...