Page History
This section includes the following topics:
- About Precise for SQL Server tabs
- How most tabs are structured
- About drilling down in context
- About configuring your settings
- Tasks common to most tabs
- About role management in Precise for SQL Server
- Opening your Precise product from the Precise StartPoint
| Anchor | ||||
|---|---|---|---|---|
|
Precise for SQL Server continuously collects high-quality metrics from each supporting tier of your SQL Server-based custom applications infrastructure and correlates these metrics to build a clear picture of application performance from the end-user's perspective—that is, response time.
...
The following table describes which tasks can be performed in each tab.
Table 2- 1 Precise for SQL Server tabs
| Tab | Description |
|---|---|
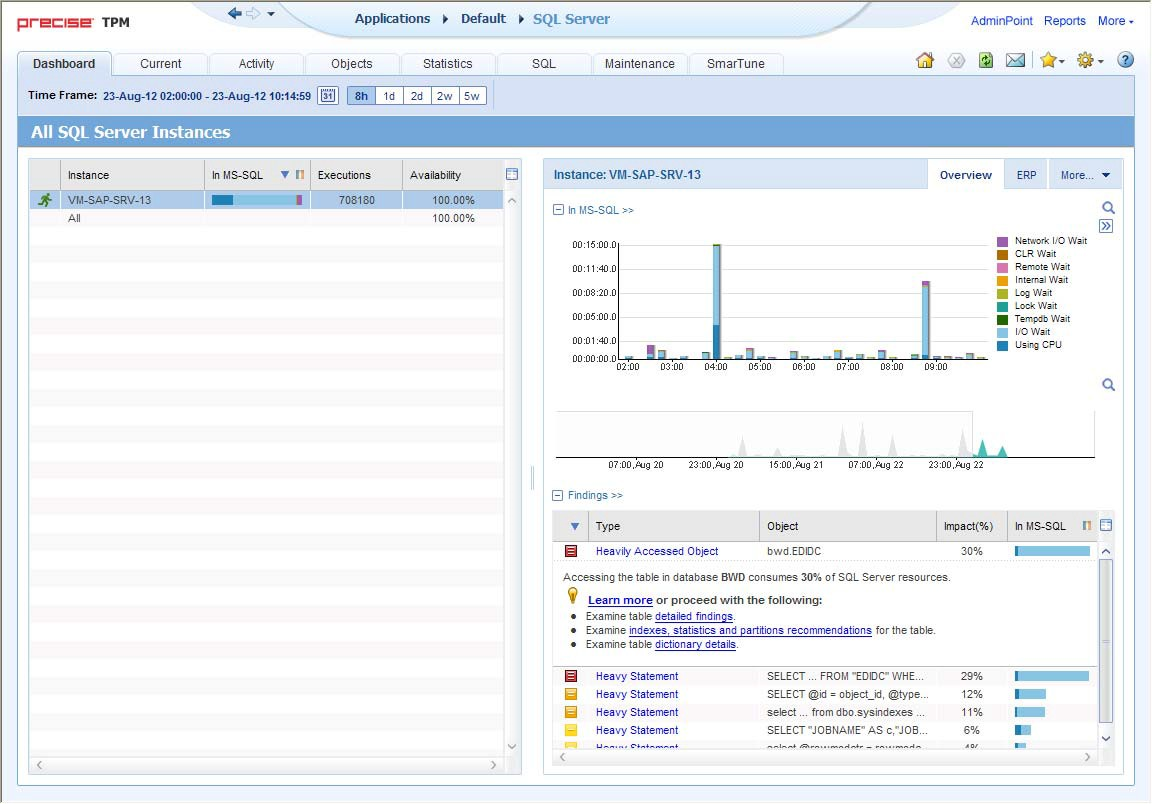
| Dashboard | Allows you to quickly identify which SQL Server instance has a performance problem, providing the first glimpse into where the problem lies. |
| Current | Allows you to solve the performance problems that are happening now. |
| Activity | Allows you to examine application performance over time and helps locate performance bottlenecks. |
| Objects | Allows you to identify which SQL Server objects are used inefficiently by the application, and their effect on the application components. |
| Statistics | Allows you to identify performance bottlenecks in the way SQL Server instance resources are used. |
| SQL | Allows you to tune problematic SQL statements or stored procedures. |
| Maintenance | Displays information on SQL Agent activities and other SQL Server activities related to DBA. maintenance tasks. |
| SmarTune | Displays performance findings that may indicate potential problems in the instance. The list of problems includes the following:
|
| Anchor | ||||
|---|---|---|---|---|
|
Though each tab is structured differently, most tabs consist of two different areas. Each area can include different control elements, such as tabs and view controls, and displays information in various formats, such as tables, graphs, or charts. The various areas are related to each other in that performing an action in one area affects the information displayed in other areas on the page. For example, the Current tab contains an upper and a lower area. The lower area (Association area) shows information in a table format. Each row in the table represents an application. The upper area (Main area) displays general information on the selected entity as well as related applications.
...
In the Association area, click the row of the application you want to view detailed information for. The Tab heading indicates the newly selected entity; the Main area displays information on the application you drilled down to, and the Association area shows information on statements executed by this application.
Figure 2- 1 How a typical tab is structured
| Anchor | ||||
|---|---|---|---|---|
|
The Precise bar enables you to keep track of where you have been and provides various controls. The following table describes the function of each of the toolbar buttons.
Table 2-2 Precise bar functions
| Icon | Name | Description |
|---|---|---|
 | Back | During a work session, keeps track of where you have navigated to. The Back and History buttons enable you to navigate between previously visited views. The Back control displays your previous view. |
 | Forward | Enables you to navigate to the next view. This button is only enabled if you clicked Back or if you chose a history option. |
 | AdminPoint | Opens Precise AdminPoint. |
 | Home | Navigates to the highest level entity, usually the instance or Tier (all instances). The time frame settings remain the same. |
 | Stop | Stops a request for information from the server. |
 | Refresh | Updates the data currently displayed. |
 | Favorites | Enables you to add or remove favorites in your Favorites list. |
 | Send | Opens a new email message in your email program with the link to the current application in context. |
 | Settings | Opens the General Settings and Time Frame Settings dialog boxes. |
 | Help | Opens the online help in context. |
| Anchor | ||||
|---|---|---|---|---|
|
The Main area displays general information on the selected entity. The structure of this area depends on the selected entity and tab.
...
In some tabs, you can filter the contents of the view by clicking the Filter button. See “Filtering data” on page 30 Filtering data.
| Anchor | ||||
|---|---|---|---|---|
|
The Association area lists entities that have similar attributes and that are related to the selected entity named in the Tab heading. Besides the Tab bar, the Association area is the main navigation tool. It enables you to drill down from one entity to related entities (usually of a different type).
...
The Association control, accessed by the arrow icon, allows you to associate with different entities. The last option, More..., opens a dialog box that lets you carry out additional operations, such as to view additional associations, change the sort order, or control the number of returned rows.
...
The Association area lets you drill down to another entity by clicking a row. The information displayed in both the Main area and the Association area will change to reflect your selection.
See “Filtering data” on page 30 and “Associating See Filtering data and Associating entities with data that meets specific criteria” on page 30criteria.
About the Findings area
For selected tabs in Precise products, the association area includes the Findings area, displaying problematic findings for the application. The findings feature is a high level tool, designed to provide the user with an overview of performance issues within the monitored application and enable quick and efficient navigation to the relevant tab for further analysis and handling. The displayed performance findings may indicate performance deterioration as well as incorrect methods usage. Each finding appears as a row in the displayed table of findings. Hover the mouse indicator over the single-line displayed finding to expand the finding. When expanded, the finding details area provides important guidelines as to what may be the root cause for the reported problem, and what the recommended steps are to resolve this problem.
The table below describes the information that is displayed in the Findings area.
Table 2- 3 Information displayed in the Findings area
...
| Column | Description |
|---|---|
| Severity | The severity of the finding is calculated using a formula. The position of the finding in the list is determined by an internal scoring system that is based on the knowledge of Precise product experts. The severity is indicated by the following colors: |
...
|
...
|
...
|
...
By default, findings are displayed according to severity. |
...
| Finding | A short name of the Finding. |
...
| Context | Entity/Method name (unless specified for the whole instance). The entity/method name is a short name but the long name is displayed in the ToolTip. Some of the findings are identified in specific Methods while others are relevant for the entire instance. In the latter case, a finding is specified as an instance-related finding. |
...
| ||
| Finding |
...
| overview | Displays specific details regarding the finding in context. |
...
| ||
| Learn more (advice) |
...
Provides recommendations for solving the selected finding. For each finding, it lists all relevant pieces of advice and all applicable solutions. You should carefully review all data for the finding and then choose the advice that best suits your needs.
|
...
| |
| Proceed with the following (bullets) |
...
Provides expert knowledge about the selected finding. The information displayed will direct you if you have difficulties deciding which advice to take or which solution to implement. |
...
|
Investigating a finding
Perform the following steps to investigate a finding.
...
For more information, see “SQL Server Findings” on page 213. SQL Server findings.
| Anchor | ||||
|---|---|---|---|---|
|
The term '"in-context' " means that you can display additional information on a selected item by drilling down to another tab or view. The filter settings you defined (for example, the selected time frame you chose) and the entity you selected are carried over to the other view or tab, to allow you to continue analyzing your subject from a different perspective. This concept takes on slightly different meanings depending upon where you are attempting to drill down in context from.
...
In short, the information displayed when drilling down in context is always related to your original selection’s settings.
How a
...
drill-down affects the Tab heading
The Tab heading displays the name of the currently selected entity on this screen. When you drill down to a new entity in the Association area, the Tab heading changes to reflect the name of the newly selected entity. See “How How most tabs are structured” on page 23.structured.
| Anchor | ||||
|---|---|---|---|---|
|
The following settings allow you to control the appearance and behavior of the user interface. They can be configured from the Settings menu on the Precise bar:
- General settings - Includes the General, Display, and Tree view tabs.
- SmarTune settings
- Time Frame settings
About configuring general settings
On the General tab of the General Settings dialog box, you can adjust the following:
- Number of items that will be displayed for each association. From the list, select the maximum number of items that will be displayed in a table. The default is 50 items. You can control the number of items returned for a specific association by using the More... option option in the Association controls. This way, you can display up to 500 items.
- Maximum number of characters to display in a text ToolTip. When you move your cursor over text columns in a table listing Statements or PL/SQLs, a ToolTip appears, displaying more text than can normally fit into a table cell. This field controls the maximum number of characters that can be displayed. The default is 500 characters.
- How often the information in the Current tab is refreshed. If you select the Auto-refresh Current tab every check box, the Current tab automatically refreshes at the specified interval. By default, the tab is not refreshed automatically. If you select this option, the default refresh interval is every five minutes.
About configuring tuner settings
In the Tuner tab you can change the Login name and Password used when launching Microsoft® Microsoft SQL Server Query Analyzer and the Recommend Indexes processes.
About configuring display settings
When you drill down to or choose a different entity, selecting the option on the Display tab of the General Settings dialog box allows you to maintain the selected view or tab when changing from one tab to another. This is sometimes referred to as sticky tabs.
About configuring Tree view settings (Only applies to Precise products that include a Tree view)
On the Tree View tab of the General Settings dialog box, you can adjust the following:
- Number of categories to display when expanding an item.
- Number of items to display when expanding a category.
About configuring SmarTune settings
You control the maximum number of findings to display in the Findings area and whether or not you want to ignore findings, in the SmarTune settings dialog box. See “Configuring Findings settings” on page 212 Configuring Findings settings.
About configuring Time Frame settings
You can determine the resolution of the data that is displayed in the overtime graphs using the Time Frame Settings dialog box. By using this dialog box you can define the default time frame to display.
| Anchor | ||||
|---|---|---|---|---|
|
The following tasks are commonly performed in most tabs:
- Switching to a different tab
- Selecting a time frame
- Selecting an entity
- Filtering data
- Associating entities with data that meets specific criteria
- Focusing on information in overtime graphs
- Sending an email message
- Adding, viewing, and deleting Favorites
- Determining which table columns to display
- Copying data to the clipboard
- Exporting to the Precise Custom Portal
- Exporting to the Precise Custom Portalthe information
| Anchor | ||||
|---|---|---|---|---|
|
You can easily switch between the different tabs using the Tab Selection bar. When you start your Precise product, the Dashboard tab opens by default. For other Precise products, another tab will open by default. The button of the selected tab is displayed in orange.
To select a tab, click a button on the Tab Selection bar to display information on the selected entity in a different tab.
| Anchor | ||||
|---|---|---|---|---|
|
You can configure Precise for SQL Server to display transaction performance data for a specific time frame using the predefined time frame options or calendar icons.
Selecting a predefined time frame from the toolbar displays transaction performance data for the selected time period up to the current time. See “Selecting Selecting a predefined time frame from the Precise for SQL Server toolbar” on page 29toolbar.
Selecting the time frame using the calendar icon, you can choose to define a time range independent of the current time, or to define a time range up to the current time. See “Selecting Selecting a time frame using the calendar icon” on page 29icon. The predefined time frame options are:
...
The time frame selected affects all information displayed in Precise for SQL Server. Only data that falls within the selected time frame is shown in these areas.
| Anchor | ||||
|---|---|---|---|---|
|
To select a predefined time frame, from the Precise for SQL Server toolbar, select one of the predefined time frames.
| Anchor | ||||
|---|---|---|---|---|
|
To select a time frame
- Click the calendar icon. In the dialog box that is displayed perform one of the following:
- To define a time frame independent from the current time, select the ‘Time Range’ option and Time Range, and then select the Start and End dates and times.
- To define a time frame up to the current time, select the ‘Last’ option Last, and then enter the desired time frame.
- To use one of the three previously used time frames, select the ‘Recently used’ option and from the drop-down menu Recently used, and then select the desired time frame.
- To use a previously saved time frame, select Use a previously saved time frame and from the drop-down menu , and then select the desired time frame.
- To save your settings for future access, select Save these definitions for future use as: , and then enter a name in the corresponding field.
- Click OK.
| Anchor | ||||
|---|---|---|---|---|
|
You can select the entity that you want to examine in more detail.
To select an entity, on the Main area of the tab, select the entity you want to examine.
| Anchor | ||||
|---|---|---|---|---|
|
You can focus on specific contents of the Dashboard and Activity tabs by showing a subset of the information. This shows the contribution of entities such as programs and users.
...
When you apply your selections in the Filter dialog box, the information displayed in both the Main area and the Association area is modified to reflect your selections. Also, the filtering continues to apply when you drill down to associated entities.Note:
| Info |
|---|
You can enter multiple criteria, in which case each criterion is applied using the logical AND operator. |
To filter data
- Click Filter is Off/Filter is On.
- In the Filter dialog box, do the following for each entity you want to filter:
- From the left drop-down list, select an entity.
- From the middle drop-down list, select an operator, such as, Like, <>, Not Like, In, Not In.
- In the text box, type the criteria (case-sensitive) for the selected entity.
If you select the operator Like or Not Like, you can use the % wildcard character to represent 0 or more characters, and the _ wildcard character to represent exactly one character. If you select the operator In or Not In, type a comma to separate values.
- Click OK.
| Anchor | ||||
|---|---|---|---|---|
|
You can associate the displayed entity with specific data to focus your analysis.Note:
| Info |
|---|
The criteria no longer apply when you drill down to another entity. |
To associate entities with data that meets specific criteria
- Click the arrow located to the left of the Association controls and select More... (applies to Current and Objects tabs only)
- In the Associate With dialog box, on the Entries tab, select the entity you want to associate data with from the Populate table with list.
- In the Sort entries by list, determine according to which criteria you want the information to be sorted and in which order.
- From the Display top list, select the number of rows to display.
- On the Criteria tab, do the following for each entity you want to associate data with:
- From the left drop-down list, select an entity.
- From the middle drop-down list, select an operator, such as, Like, <>, Not Like, In, Not In.
- In the text box, type the criteria (case-sensitive) for the selected entity.
If you select the operator Like or Not Like, you can use the % wildcard character to represent 0 or more characters, and the _ wildcard character to represent exactly one character. . If you select the operator In or Not In, type a comma to separate values.
- Click OK.
Saving a statement
Save As allows you to save the statement or batch so that you can examine its access plan at a later date.
...
- Select the statement you want to save in the Association area.
- Click Save As.
- In the Save Statement dialog box, enter the following properties:
- Instance. The name of the instance that the statement belongs to.
- Cabinet. The name of the cabinet that the statement is saved in (creates a cabinet if it does not already exist).
- Folder. The name of the folder that the statement is saved in (creates a folder if it does not already exist).
- Name. The name of the statement (generated randomly).
- Database. The name of the database where the statement is running.
- User. The statement's parsing user.
- Enter the SQL text for the statement in the Text frame.
- Click OK.
The new statement is saved in the PMDB in a logical cabinet and folder hierarchy.
| Anchor | ||||
|---|---|---|---|---|
|
Some entities display an overtime graph. The overtime graph displays entity statistics over a specified time period. Depending on the number of points displayed in the graph, you may need to zoom in or out. The text displayed on the x-axis varies according to the time frame. If there is a year or day change, x-axis labels will display accordingly.
To focus on information in overtime graphs, select the desired time frame on the overtime graph, click and drag the left or right handle to increase or decrease the time range. The small zoom (spyglass) icon will display on the upper right of the selected time range, and above the overtime graph legend. Click the zoom icon to zoom in according to the selected time frame.
| Anchor | ||||
|---|---|---|---|---|
|
You can send an email message to one or more recipients from the Precise toolbar. The default subject for the message will be “Link is, "Link to a Precise application”application."
The email will include a link to the Precise product in the current context (time frame and selected entries).
...
- Click the email icon on the Precise toolbar. The default email program opens.
- Fill in the required fields and click Send.
| Anchor | ||||
|---|---|---|---|---|
|
The Favorites feature allows you to save a specific location in your application and to retrieve the same location later without having to navigate to it.
About the Favorites feature
The new Favorites feature includes the following options:
- Relative Time Frame. Saving a relative time frame instead of static date. For example, saving the last 7 days will always display the last 7 days, depending on the day entered.
- One click to specific location. Once you open Precise by launching a saved Favorite item, you will not have to enter a login credential nor click the login button.
- IE Favorites support. Adding a new Favorite item in Precise will also add it to the IE Favorites menu.
- Auto Complete. The Favorites dialog includes a new combo box which supports AutoComplete.
- Auto Naming. The Favorites dialog generates item names based on the current location.
UI description
A Favorites menu has been added to the Precise bar in each product including StartPoint.
...
- On the Add/Delete Favorites dialog box, enter the name of the new Favorites entry.
- Click Add. The dialog box is closed and the new Favorite is added to the list.
...
- On the Precise bar, click Favorites.
- Select the Favorites location you want to view.
...
- On the Add/Delete Favorites dialog box, select the Favorite location to be deleted.
- Click Delete. The dialog box closes and the selected Favorite is deleted from the list.
| Info |
|---|
...
The favorite address is displayed in the Address field and cannot be edited. |
| Anchor | ||||
|---|---|---|---|---|
|
Tables are used to display information about a set of related entities in the Main and Association areas. It is possible to determine which columns to display in the Association area tables.
...
- Click the Table icon on the upper right-hand side of a table and select Column Chooser.
- In the Table columns dialog box, click the arrows to move the names of the columns that you want to display to the Visible box and the ones that you do not want to display to the Invisible box.
- Click OK.
| Anchor | ||||
|---|---|---|---|---|
|
At times you may want to save data displayed in the table area in a Microsoft Excel spreadsheet for further analysis or save an image of a graph to the clipboard.
To copy data displayed in the Association area to the clipboard, click the Table icon on the upper right-hand side of a table and select Copy to clipboard. The table can be pasted into Microsoft Excel or as an HTML file.
To copy a graph to the clipboard, right-click a graph and choose Copy to clipboard. You can now paste the image into any application that works with the clipboard.
| Anchor | ||||
|---|---|---|---|---|
|
The Export to the Precise Custom Portal Portlet feature enables you to export the view of the chosen table or graph and generate a portlet with that view in the Precise Custom Portal, so that it will provide you with another way of monitoring your application.
Prerequisites
To be able to use this feature, you need to have the following rights in Precise: View permissions to all Tiers in the application
...
. If you do not have sufficient rights, you will get an error message when trying to execute this feature.
| Anchor | ||||
|---|---|---|---|---|
|
You can either export a table view or a graph view.Note:
| Info |
|---|
The name field has the following restrictions: maximum 100 characters. |
To export a table view
- Click the Column Chooser icon.
- Select Export to the Precise Custom Portal Portlet.
- Insert a name in the name field that clearly describes the table view.
- Click OK.
To export a graph view
- Right-click the graph.
- Select Export to the Precise Custom Portal Portlet.
- Insert a name in the name field that clearly describes the graph view.
- Click OK.
| Anchor | ||||
|---|---|---|---|---|
|
The Roles management feature in Precise for SQL Server lets you assign roles to users and control whether they will be able to do the following operations:
...
For more information on configuring permissions and roles, see the Precise Administration Guide.
| Anchor | ||||
|---|---|---|---|---|
|
Precise is a Web-based application. You can access the Precise user interface using the Internet Explorer browser, version 6.0 or later. The syntax of the Precise URL address is: http://<server>:<port>, where <server> refers to the Precise FocalPoint server and <port> refers to the port number used by the GUI Web server. By default, the port number is 20790 (20760 for J2EE). For example: http://beanotown:20790.
This URL provides secure access to the StartPoint using authorized roles. From here, you can launch all Precise products. It gives you a quick overview of the status of your applications and access to the AdminPoint, where you can perform various management tasks (.
For more information, see the Precise Administration Guide for details).Note:
| Info |
|---|
You must have local administrator privileges on the server where the StartPoint is running. |
To open your product using Precise StartPoint
- Type the address of the StartPoint user interface into the Address bar of your browser and Click click Enter. The Precise login page opens. The login page provides secure access to Precise and to your specific product.
- Specify your authorized role name and password. By default, both role name and password are admin. For For more information about role names, see the Precise Administration Guide.
- Click Login. The StartPoint page opens. This is the Precise home page.
- On the Product Selection bar, from the drop-down list, select the product you want to open.
Precise. Performance intelligence from click to storage. Learn more > >
...
...