Page History
This section includes the following topics:
- About the Activity tab
- How the Activity tab is structured
- About the entities you can examine
- How the Activity tab can help you identify performance problems
| Anchor | ||||
|---|---|---|---|---|
|
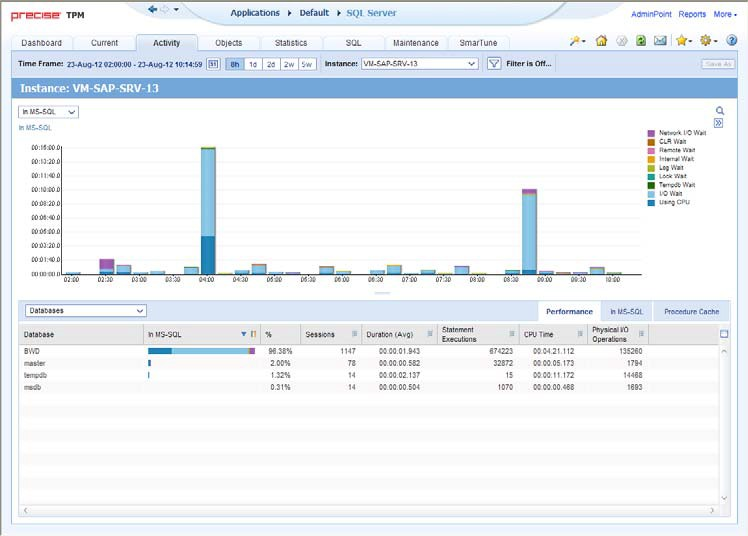
The Activity tab allows you to analyze performance behavior over time or within a given time period. When investigating a performance issue, the Activity tab is an excellent place to start. You can easily identify the performance profile of your SQL Server instance and determine who is executing which application, what they are waiting for and how many resources are they consuming. This is the critical information you need to identify the top consumers of your SQL Server Instance and its major latencies. By focusing on the top consumers and latencies (wait states) you can maximize the tuning impact on your system while minimizing the time it takes to obtain results.
...
The Activity tab was designed to answer questions such as, "What happened yesterday, as well as a month ago and a year ago?" and "What has been the performance level of my applications over time.".
Data in the Activity tab is available up to the last time slice that ended (information on the last minute is available in the Current tab). The Activity tab is usually the place to identify and investigate tuning problems.
When working in the Activity tab, you can choose to work on a specific instance or to view information on all your instances, in the application.Note:
| Info |
|---|
You usually switch to the Activity tab, after focusing on an instance in the Dashboard tab, or by launching Precise for SQL Server from another product (Precise for SAP, Precise for Microsoft .NET, Insight, Alerts, or Report Manager). In these cases, the product automatically focuses on the relevant instance. |
When you don't select a specific instance to view in-context, a summary of the performance information of All Instances in the application is displayed. You can analyze the average behavior of the entire SQL Server Tier. You can then identify the instance which consumes the most resources in your system and focus on it to further your investigation.
When you focus on a specific instance (either as a result of launching or from the SQL Server Tier view) you can also identify which is the dominant resource consumed, in terms of CPU, I/O lock, etc. By identifying your system's wait type you can formulate an idea as to what kind of solutions will help you improve your system.
| Info |
|---|
...
If you are working with SAP, PeopleSoft, or Siebel, and ERP support is installed, the Activity tab displays information on the historical SQL Server activity in relation to the ERP application and users, and specific information on executed views and transactions. |
| Anchor | ||||
|---|---|---|---|---|
|
Figure 6- 1 Precise for SQL Server Activity tab structure
The Activity tab displays information on various entities and their associated entities. The information displayed when you launch the Activity tab depends upon where you are launching from.
...
- Keeping the entity in the Main area but selecting a different set of entities to view in the Association are, by selecting an entity from the Association controls list.
- Switching to a different entity by drilling to another entity from the Association area.
- Switching to a different view in the Main area, thereby displaying additional information the selected entity.
About the Main area in the Activity tab
The Main area shows comprehensive information on the selected entity. You can choose from several views to examine the entity from different angles. For example, you can focus on an In MS-SQL overtime graph for an Instance entity to observe its resource consumption over time or you can focus on the Locking view to investigate all the locks performed on the instance.
See “About About drilling down in context” on page 27, “About context, About the Precise bar” on page 24, “About bar, About the Main area” on page 25, “About area, About the Association area” on page 25area, and “Focusing Focusing on information in overtime graphs” on page 32graphs.
About navigating in the Activity tab
The name of the entity you selected is displayed in the tab heading, which serves as a point of orientation. The highest level entity that you can view information for in the Activity tab is the Tier.
Moving the pointer over the Tab heading displays a ToolTip with navigational information that traces the path you have already taken in your investigation.
About the Association area in the Activity tab
The Association area displays relevant information on the entities associated with the selected entity (displayed in the Tab heading in the Main area) in a table format. For example, it is possible to associate to Databases, Statements and Logins that are related to a specific Instance, by selecting an entity from the Association controls list. Notice that some entities, show additional information on the associated entities in different tabs. The tabs are located above the Association area table. Clicking on a tab displays different table columns showing different information for the associated entities. For example, the following tabs show additional information for the Statement entity:
...
For example, when you want to drill down to an associated entity, such as a specific program, to view additional information, choose Programs from the Association controls. Note that the Tab heading and the Main area remain unchanged. Click the row of the program you want to view detailed information for. The Tab heading indicates the newly selected program; the Main area displays In MS-SQL information on the program you drilled down to, and the Association area shows information on statements executed by this program.
See “About About drilling down in context” on page 27, “About context, About the Precise bar” on page 24, “About bar, About the Main area” on page 25, “About area, About the Association area” on page 25, “Focusing area, and Focusing on information in overtime graphs” on page 32. See “How most tabs are structured” on page 23, “Tasks common to most tabs” on page 28, and “About the Dashboard tab” on page 46.
About the entities you can examine
| Anchor | ||||
|---|---|---|---|---|
|
The Activity tab displays information on different entities. The Activity tab displays information on different entities. This section provides an overview of all entities, their meaning, and their views. By default, all entities open in the In MS-SQL view, with the exception of the Statement, Batch, Collapsed Statement and Collapsed Batch entities which open by default in the Overview view.
...
- All Instances
- Instance and Collector Entities
- Statement, Batch, Collapsed Statement or Collapsed Batch Entities
- Session and Blocker Session Entities
- Locked Object Entity
- Table and Index Entities
- I/O Entities
| Info |
|---|
...
Some of these entities have been grouped together logically because they can be described similarly. They appear separately when viewed in the GUI. |
About the All Instances entity
An A Tier entity displays the resource consumption of all the instances in the application in the following views:
- Overview
- In MS-SQL
- Internal wait
- Instance grouping
About viewing a summary of system performance and resource consumption for All Instances
The Overview displays a summary of the performance and resource consumption of all instances in the application, as follows:Instances Displays
- Instances. Displays the number of Instances defined in the Tier.
In MS-SQL breakdown
...
table. Displays the resource consumption breakdown of all the instances over the selected time period, as follows:
Info
...
The table only displays the states the selected entity was in. For example, if the selected entity was not waiting for an I/O wait during the selected time period, the table will not display I/O wait parameters.
About viewing In MS-SQL data for All Instances
This view displays an overtime graph of the total time spent In MS-SQL for all instances in the SQL Server Tier.
About viewing the Internal Wait time experienced by All Instances
The Internal Waits view shows a breakdown of the internal wait counter in an overtime graph. The internal wait counters are broken down into the following subsets:
- Buffer Pool
- Latch
- Parallel
- Distributed Transaction Coordinator (DTC)
- DB Mirror
- Profiler
- Memory
- Backup
- Other Internal waits
See “About internal waits” on page 37 About internal waits.
About viewing Instance Grouping for All Instances
Displays instance grouping information for the selected SQL Server Tier. It is possible to categorize instances into groups and observe their tuning counters, such as their In MS-SQL breakdown, according to the groups you defined. This option is useful if there are many instances in the same application.
For an explanation on how to define instance groups, see the Precise Administration Guide.
About Instance and Collector entities
The Instance entity and the common Collector entities display the resource consumption of the entire instance (or the entity selected). When focusing on an instance, or collector entity, such as a program, you can examine how it is performing within the selected time period.
| Info |
|---|
...
The information displayed for certain entities may differ slightly than that described, according to what is relevant to the specific entity. For example, if you have navigated to a storage entity (such as a database file), only the I/O wait information for the selected entity is displayed. If you have navigated to a locked object, only the Lock wait information is displayed. |
The following table describes which Collector entities can be examined in the Activity tab.
Table 6- 1 Collector entities that can be examined in the Activity tab
| Collector Entity |
|---|
...
| Description |
|---|
Collector entity Description
...
| Database | Displays information on an activity in reference to a specific database. |
Collector entity Description
...
| Program | Displays information on an activity generated from a specific program. Displays ‘N/A' if the program_name column in sysprocesses is null. If ERP is installed, the program is updated with the ERP data. For more information, see extended ERP data. |
| Login |
...
Displays information on an activity generated by a specific login. Displays ‘N/A' if the login name column in sysprocesses is null. If ERP is installed, the login is updated with the ERP data. For more information, see extended ERP data. |
| User |
...
| Displays information on an activity generated by a specific user in the database in use. |
| Machine |
...
Displays information on an activity generated from a specific workstation. Displays ‘N/A' if the hostname column in sysprocesses is null. If InterPoint for ERP is installed, the machine is updated with the ERP data. For more information, see extended ERP data. |
| Work |
...
| Type | The Precise for SQL Server Collector divides SQL Server activities into several groups. The Work Type entity displays performance information on each group. The following groups are available: |
...
|
...
|
...
|
...
The following groups are only displayed if InterPoint for ERP is installed: In SAP: |
...
|
...
|
...
|
...
|
...
In PeopleSoft: |
...
|
...
In Siebel: |
...
|
...
|
...
|
| COM+ |
...
| For more information, see extended ERP/COM+ documentation. | |
| ERP |
...
| Data | For more information, see extended ERP/COM+ documentation. |
| Job |
...
| Displays information on an activity, with reference to a specific job. |
See “Precise Precise for SQL Server agents” on page 19agents.
The following views are available for the Instance and Collector entities:
- Overview
- In MS-SQL
- Locking
- Internal Waits
- Procedure Cache
- Overall Activity
- Scalability
- System Scalability
- Availability
About getting an overview of Instance and Collector data
The Overview displays information on the performance and resource consumption of the collector entities. The following information is displayed:Load Displays
- Load. Displays information on the following session-related items, as follows:
...
- Sessions. Number of sessions that occurred during the specified time period of the selected collector entity. For example, if you are viewing the Login entity, this value represents the number of sessions that are connected to the selected Login.
...
- Duration (Avg)
...
- . Average duration for a single session, in the selected collector entity, during the selected time period, calculated by dividing the Duration by the number of Sessions.
...
- Duration (Summed)
...
- . Total amount of time that elapsed for all of the selected collector entity's sessions, during the selected time period.
...
- Statement Executions. Number of statements executed within the selected time period that were generated by the selected collector entity's sessions.
...
- Statement Duration (Avg)
...
- . Average duration for a single statement execution, in the selected collector entity, during the selected time period. This value is calculated by dividing the Duration (Summed) parameter by the number of statement executions.
...
- Statistics. Displays the following session-related statistics, as follows:
...
- CPU Time. Cumulative CPU time for the collector entity or instance, during the selected time period. This counter is not accurate when SQL Server is configured to use fiber mode (lightweight pooling option).
...
- Physical I/O
...
- Operations. Total number of physical I/O operations performed by all sessions connected to the database during the selected time period.
- In MS-SQL
...
- breakdown. Displays collector entity resource consumption (table format) and shows instance breakdown, within the selected time period, as follows:
...
- State. Displays the In MS-SQL state.
...
- In MS-
...
- SQL. Displays a graphical representation of the Time column.
...
- Time. Amount of time the selected collector entity was in this state.
...
- %. Percentage of time the selected collector entity was in this state.
See
- %. Percentage of time the selected collector entity was in this state.
...
About viewing Instance and Collector In MS-SQL data
The In MS-SQL view displays the resource consumption of the selected collector entity over the selected time period. This graph enables you to analyze performance trends for the collector entity, over time.
See “About session states” on page 36.
See “Focusing See About session states and Focusing on information in overtime graphs” on page 32graphs.
About viewing Instance and Collector locking data
The Locking view displays the blocking tree and the lock wait duration broken down into lock levels (such as, Table, Page, and Key), for the selected entity, over the selected time period. The following information is displayed:Locks Displays
- Locks. Displays which sessions were involved in a blocking situation (either locking or blocking). It is important to understand which sessions are involved in each blocking chain, as there may be several sessions involved at the same time. It is then important to determine which session is blocking others, which object is being blocked, and what type of lock has been applied.
A yellow lock indicates that the session is currently blocking another session but is not itself blocked.
A red lock indicates the session is currently blocked by another session. Note that a session may also block other sessions while being blocked by a different session.
- Lock wait
...
- graph. The Lock Wait graph shows a breakdown of the Lock Waits, and when they occurred, over the selected time period.
See “Focusing Focusing on information in overtime graphs” on page 32graphs.
About the lock tree structure
To gain a better understanding of the lock tree let's take a look at its structure. Notice that the session located in the root of each chain is the session that blocks all others. Each session directly blocks all sessions positioned one level beneath it.
...
Every time a change occurs, a new lock tree is opened, as for example, when a new session enters into the lock. It is therefore possible that there will be sub-trees of several locks that may appear identical.
About viewing internal waits information for Instance and Collector entities
The Internal Waits view displays the following internal waits, indicating that the session is waiting for an internal resource to be freed:
- Other internal
...
- wait. Aggregates the following types of waits:
- Full text waits
- HTTP waits
- Query notifications
- Backup
...
- wait. Includes the wait type that commonly occurs when a Backup command is performed.
- Memory
...
- wait. Includes ten types of waits that indicate that a session is waiting for memory to be allocated to it.
- Profiler
...
- wait. Aggregates a number of states associated with the SQL Profiler and lets you see how much of the database resources it consumes.
- DB mirror
...
- wait. Aggregates the new waits that occur when DB mirroring is performed, such as the waits that occur if the communication layer used by DB mirroring becomes backlogged.
- DTC
...
- wait. Aggregates waits that occur when Distributed Transaction Coordinator (DTC) sessions have to wait for each other.
- Parallel
...
- wait. The session is waiting for one of its sub-threads to complete its operation.
- Latch
...
- wait. The session is waiting for an internal lock to be released.
- Buffer pool
...
- wait. Groups together the events that show contention on pages in the buffer pool.
About viewing procedure cache information for Instance and Collector entities
The Procedure Cache is the part of the SQL Server memory pool that stores execution plans for batches, stored procedures and triggers. The Procedure Cache view provides the following information on an execution plan:
- Load
...
- Elapsed time
- Execution count
- Avg duration
- Statistics
...
- Recompilations
- CPU time
- CLR time
- I/
...
- O
- Logical reads
- Logical writes
- Physical reads
- Avg Duration vs. Execution Count
...
- graph
- Graph showing the amount of time it took to complete the execution of a plan versus the number of times the plan was executed.
- I/O
...
- graph
- Graph showing the date and time that physical reads, and logical read/writes occurred.
About viewing overall activity of Instance and Collector entities
The Overall Activity view displays the duration of the activity performed by the selected collector entity over the selected time period, broken down into the following components:
- Waitfor Command—the Command. The amount of time applications were waiting because they were waiting for command.
- Parallel Exchange Wait—the Wait. The amount of time the thread in a parallel session is waiting for data exchange from another thread.
- Request Wait—the Wait. The amount of time applications were in a request wait state, defined as the state wherein the server is waiting for a client request.
- In MS-SQL—represents SQL. Represents total amount of time spent in SQL Server. See “Focusing Focusing on information in overtime graphs” on page 32graphs.
About viewing Instance and Collector Scalability
The Scalability view displays two overtime graphs that allow you to examine the scalability of the selected collector entity, as follows:
- Sessions duration (Avg) vs.
...
- sessions. Compares the average duration of the selected collector entity with the number of sessions, over the selected time period. For example, if the selected collector entity is Login the graph will show the number of sessions connected with the selected login versus the average duration of each session over time. Use this graph to analyze if the average session duration increases when the number of sessions increase.
- I/O wait vs. physical I/O
...
- Operations. Compares the amount of time the collector entity waited for the I/O to be completed with the actual physical I/O requests performed on behalf of the collector entity. Use this graph to analyze how an increase of physical I/O requests affects the I/O wait of the collector entity.
See “Focusing Focusing on information in overtime graphs” on page 32graphs.
About viewing Instance and Collector System Scalability
The System Scalability view displays two overtime graphs that allow you to examine the scalability of the selected collector entity when analyzing OS metrics, as follows:
- In MS-SQL vs. SQL server CPU usage (%)
...
- . Compares the In MS-SQL of the selected collector entity with SQL Server CPU usage over the selected time period. For example, if the selected collector entity is Login the graph will show the In MS-SQL time consumed by the selected login and SQL Server CPU utilization over time. Use this graph to evaluate the correlation between collector entity performance and the SQL Server CPU usage. For example, you can determine if high CPU utilization is a result of collector entity's activity.
- Physical I/O Operations vs. queue length (Avg)
...
- . Compares the physical I/O requests performed on behalf of the collector entity with the average queue length of the available disks over the selected time period. Since an increase in queue length affects application performance, this graph enables you to analyze how an increase in physical I/O requests affects queue length.
See “Focusing Focusing on information in overtime graphs” on page 32graphs.
About viewing Instance and Collector Availability
The Availability view displays the percentage of time the SQL Server instance was available, that is, it met the SLA Availability requirements configured in the SLA settings. A green bar represents the amount of time the instance availability met with SLA requirements and a Red bar represents the amount of time the instance availability was lower than SLA requirements.Note:
| Info |
|---|
During planned downtime periods the instance availability is displayed as if it was available. This view is available only for instance and database entities. |
The following information is displayed in this view:Availability Displays
- Availability. Displays the percentage of time the SQL Server was available (including planned down time; for more information see the Precise Administration Guide).
- Unavailability
...
- times. Displays how long the SQL Server was down. If the Precise for SQL Server Collector was down, the status will be labeled "Unknown Time."
- Log.
...
- Provides general information regarding each period that the SQL Server was down.
Provide information on the status of SQL Server instance, over the selected time period. If the instance was down or if the status was unknown (the Collector was down) during the selected time period, only information on the unavailability of the instance is displayed (time range of the unavailability period).
See “Focusing Focusing on information in overtime graphs” on page 32graphs.
About the Instance and Collector entities Association area
Additional information on performance, In MS-SQL activity, and the procedure cache, for the instance and collector entities, is displayed in the Association area tabs.
Clicking a tab shows additional information on the entities displayed in the Association area table. The rows of the table remain the same; the columns change to display additional details on the entities listed in the table.
About viewing performance data for Instance and Collector entities
The following table describes the additional information displayed in the Performance tab in the Association area.
Table 6- 2 Information displayed in the Performance tab
| Column |
|---|
...
| Description |
|---|
| Entity |
...
| name (such as |
...
| instance, database, etc.) | Displays the name of the entity. |
| In MS- |
...
| SQL | Displays entity resource consumption (default: stacked bar chart) and shows entity breakdown, over the selected time period. |
| % |
...
| Displays the percentage of the total In MS-SQL. |
| Sessions |
...
| Number of sessions that occurred during the selected time period of the selected entity. |
| Duration (Avg) |
...
| Average duration for a single session, in the selected entity, during the selected time period, calculated by dividing the Duration by the number of Sessions. | |
| Statement |
...
| Executions | Number of statements executed within the selected time period that were generated by the selected entity's sessions. |
| CPU |
...
| Time | Cumulative CPU time for the entity during the selected time period. This value is calculated by the Collector as follows (this value is an approximation)—the CPU Time field in sysprocesses is sampled at the start point and end point. The value sampled at the start point is subtracted from the value sampled at the end point resulting in the CPU Time reported. The start and end points are determined according to values that have changed. For example, a session is sampled by the Collector for five seconds, but the start and end points were calculated according to when a value has changed. As a result, the calculated CPU Time in this example is only three out of the sampled five seconds since this is takes into consideration when the value has changed. |
About viewing In MS-SQL data for Instance and Collector entities
The In MS-SQL tab contains the In MS-SQL counter and the breakdown of the In MS-SQL into its states. The In MS-SQL is displayed with a normalized view while all the other counters display the time each state was consumed. See “About session states” on page 36See About session states.
About viewing procedure cache data for Instance and Collector entities
The Procedure Cache is the part of the SQL Server memory pool that stores execution plans for batches, stored procedures and triggers. Detailed information on the execution plan run of a specific instance is displayed in the Procedure Cache tab.
The following table describes the information displayed for execution plans in the Procedure Cache tab.
Table 6- 3 Information displayed in the Procedure Cache tab
| Column |
|---|
...
| Description |
|---|
Entity name (such as Instance, Database) |
...
| Displays the name of the entity. | |
| Elapsed |
...
| Time | Amount of time it took to complete the executions of the plan. |
| Execution |
...
| Count | Number of times the plan was executed. |
| Avg |
...
| . Duration | Average amount of time it took to execute the plan, calculated as total elapsed time divided by the execution count. |
| Recompilations |
...
| Number of times a plan was recompiled while it remained in the procedure cache. |
| CPU |
...
| Time | Amount of CPU time consumed by the executions of the plan. |
| CLR |
...
| Time | Time consumed inside CLR objects by the executions of the plan. |
| Logical I/ |
...
| O | Number of logical reads and writes performed by the executions of the plan. |
| Physical |
...
| Reads | Number of physical reads performed by the executions of the plan. |
About Statement, Batch, Collapsed Statement or Collapsed Batch entities
When an application component (such as Database or Login) consumes resources in SQL Server, it is actually executing a statement that is consuming resources. Tuning performance problems typically involves finding and tuning offending statements.
The following table describes which performance and resource consumption information is displayed for the statement, batch, collapsed statement and collapsed batch entities.
Table 6- 4 Statement, Collapsed Statement, Batch and Collapsed Batch entities
| Entity |
|---|
...
| Description |
|---|
...
| Statement |
...
Displays information on the activity of a specific TSQL statement. A statement is always part of a batch. When an encrypted stored procedure is encountered the statement |
...
displays, "Encrypted Text." | |
| Batch | Displays information on the activity of a specific batch. A batch can either be a stored procedure, stored function, trigger, or an ad hoc batch. If it is a stored object, the name of the stored objects are displayed. |
| Collapsed |
...
| statement | Represents similar statements that differ in their parameters (literals). In a collapsed statement, the literals are replaced with parameter markers. The collapsed statement lets you analyze the overall resource consumption of similar statements. |
| Collapsed |
...
| batch | Similar to collapsed statement a collapsed batch represents similar batches that differ in their parameters (literals). In a collapsed batch, the literals are replaced with parameter markers. The collapsed batch lets you analyze the overall resource consumption of similar batches. |
| Info |
|---|
...
The information displayed for certain entities may differ slightly than that described, as is relevant for the specific entity. For example, if you have navigated to a storage entity (such as a database file), only the I/O wait information for the selected entity is displayed. If you have navigated to a locked object, only the Lock wait information is displayed. |
See “About Statement identifiers” on page 38 About Statement identifiers.
The following views are available for the Statement, Batch, Collapsed Statement and Collapsed Batch entities:
- Overview
- Text
- In MS-SQL
- Locking
- Internal Waits
- Procedure Cache
- Scalability
- System Scalability
About getting an overview of Statement, Collapsed Statement, Batch and Collapsed Batch entities
The Overview displays information on the entity's activity, such as its number of executions and average statement duration. In addition the resource consumption breakdown and the text of the statement or batch are also displayed, as follows:Load Displays
- Load. Displays information on the following session-related items:
...
- Database. Identifies the statement's database.
...
- User. Identifies the statement's parsing user.
...
- Statement Executions. Number of times the Collector identifies that the statement was executed during the selected time period.
...
- Statement Duration (Avg)
...
- . Displays the average duration of each statement execution within the selected time period, calculated by dividing the Duration (Summed) by the number of Statement Executions.
...
- Statement Duration (Summed)
...
- . Total elapsed time required to run all executions of the selected statement or batch during the selected time period.
...
- Statistics. Displays the following statement-related statistics:
...
- CPU Time. Cumulative CPU time for the entity during the selected time period. This value is calculated by the Collector as follows (this value is an approximation)—the CPU Time field in sysprocesses is sampled at the start point and end point. The value sampled at the start point is subtracted from the value sampled at the end point resulting in the CPU Time reported. The start and end points are determined according to values that have changed. For example, a statement is sampled by the Collector for five seconds, but the start and end points were calculated according to when a value has changed. As a result, the calculated CPU Time in this example is only three out of the sampled five seconds since this is takes into consideration when the value has changed.
...
- Physical I/O
...
- Operations. Total number of physical I/O requests during statement execution, within the selected time period.
...
- Parallel Sessions (Min)
...
- . Certain statements are executed using parallelisms. This counter displays the minimum number of threads used to execute the statement and is calculated by examining the
ecidcolumn insysprocesses. Check this counter to verify that the SQL Server is implementing the best execution plan for the statement.
- . Certain statements are executed using parallelisms. This counter displays the minimum number of threads used to execute the statement and is calculated by examining the
...
- Parallel Sessions (Max)
...
- . Certain statements are executed using parallelisms. This counter displays the maximum number of threads used to execute the statement and is calculated by examining the
ecidcolumn insysprocesses. Check this counter to verify that the SQL Server is implementing the best execution plan for the statement.
- . Certain statements are executed using parallelisms. This counter displays the maximum number of threads used to execute the statement and is calculated by examining the
- In MS-SQL breakdown
...
- . Displays resource consumption broken down into states, such as, Using CPU, I/O Wait, Lock Wait, etc., within the specified time period. This allows you to identify the highest resource consumers.
...
- Text. Displays statement or batch text (formatted for easy readability).
When viewing a batch entity, the entire text of the
...
- ad-hoc batch or stored object is displayed.
When viewing a statement, only the part of the batch that generates the statement is displayed.
When viewing a collapsed statement or batch, the literals are replaced with parameter markers.
About viewing Statement, Collapsed Statement, Batch and Collapsed Batch text
The Text view displays the SQL Text of the statement or batch.
About viewing In MS-SQL data for statements, collapsed statements, batches and collapsed batches
The In MS-SQL view displays the resource consumption of the selected entity over the selected time period. This graph enables you to analyze performance trends for the entity, over time.
See “Focusing Focusing on information in overtime graphs” on page 32graphs.
About viewing Statement, Collapsed Statement, Batch and Collapsed Batch entities locking
The Locking view displays the blocking tree and Lock Wait duration of the selected entity over a specified time period broken down into lock levels such as, Table Lock, and Page Lock. The following information is displayed:Locks Displays
- Locks. Displays which sessions were involved in a blocking situation (either locking or blocking). It is important to understand which sessions are involved in each blocking chain, as there may be several sessions involved at the same time. It is then important to determine which session is blocking others, which object is being blocked, and what type of lock has been applied.
A yellow lock indicates that the session is currently blocking other sessions but is not itself blocked.
A red lock indicates the session is currently blocked by another session. Note that a session may also block other sessions while being blocked by a different session. - Lock wait
...
- graph. The Lock Wait graph shows a breakdown of the Lock Waits, and when they occurred, over the selected time period.
See “Focusing Focusing on information in overtime graphs” on page 32graphs.
About the lock tree structure
To gain a better understanding of the lock tree let's take a look at its structure. Notice that the session located in the root of each chain is the session that blocks all others. Each session directly blocks all sessions positioned one level beneath it.
...
Every time a change occurs, a new lock tree is opened, as for example, when a new session enters into the lock. It is therefore possible that there will be sub-trees of several locks that may appear identical.
About viewing internal waits data for statements, collapsed statements, batches and collapsed batches
The Internal Waits view displays the following internal waits, indicating that the session is waiting for an internal resource to be freed:
- Other internal
...
- wait. Aggregates the following types of waits:
...
- Full text waits
...
- HTTP waits
...
- Query notifications
- Backup
...
- wait. Includes the wait type that commonly occurs when a Backup command is performed.
- Memory
...
- wait. Includes ten types of waits that indicate that a session is waiting for memory to be allocated to it.
- Profiler
...
- wait. Aggregates a number of states associated with the SQL Profiler and lets you see how much of the database resources it consumes.
- DB mirror
...
- wait. Aggregates the new waits that occur when DB mirroring is performed, such as the waits that occur if the communication layer used by DB mirroring becomes backlogged.
- DTC
...
- wait. Aggregates waits that occur when Distributed Transaction Coordinator sessions have to wait for each other.
- Parallel
...
- wait. The session is waiting for one of its sub-threads to complete its operation.
- Latch
...
- wait. The session is waiting for an internal lock to be released.
- Buffer pool
...
- wait. Groups together the events that show contention on pages in the buffer pool.
About viewing procedure cache data for statements, collapsed statements, batches and collapsed batches
The Procedure Cache is the part of the SQL Server memory pool that stores execution plans for batches, stored procedures and triggers. The Procedure Cache view provides the following information on an execution plan:Load Elapsed
- Load. Elapsed time Execution count
...
- average duration
...
- .
- Statistics.
- Recompilations
...
- CPU time
- CLR time
- I/
...
- O. Logical reads Logical writes Physical reads
- Avg Duration vs. Execution Count graph. Graph showing the amount of time it took to complete the execution of a plan versus the number of
...
Count graph
- times the plan was executed.
- I/O
...
- graph. Graph showing the date and time that physical reads, and logical read/writes occurred.
About viewing scalability for statements, collapsed statements, batches and collapsed batches
The Scalability view displays two overtime graphs that allow you to examine the scalability of the selected collector entity over the selected time period. For example, you can determine whether the average statement duration of an entity's activity increased as a result of an increase in number of executions.
The following overtime graphs are displayed:
- Statement duration (Avg) vs. executions.
...
- Compares the average duration of the selected entity with the number of executions, over the selected time period. For example, if the selected entity is Statement, the graph will show the number of executions of the selected statement versus the average duration of each execution over time. Use this graph to analyze if the average statement duration increases when the number of executions increase.
- I/O wait vs. physical I/O
...
- Operations. Compares the amount of time the entity waited for the I/O to be completed with the actual physical I/O requests performed on behalf of the entity. Use this graph to analyze how an increase of physical I/O requests affects the I/O wait of the entity.
About viewing system scalability for statements, collapsed statements, batches and collapsed batches
The System view displays two overtime graphs that allow you to examine the scalability of the selected entity when analyzing OS metrics.
...
The following overtime graphs are available:
- In MS-SQL vs. SQL server CPU usage (%)
...
- . Compares the In MS-SQL of the selected entity with SQL Server CPU usage.
For example, if the selected entity is Statement the graph will show the In MS-SQL time consumed by the selected Statement and SQL Server CPU utilization over time. Use this graph to evaluate the correlation between entity performance and the SQL Server. CPU utilization represents an average of the utilization of all processes.
- Physical I/O Operations vs. queue length (Avg)
...
- . Compares the physical I/O requests performed on behalf of the entity with the average queue length of the available disks. Since an increase in queue length affects application performance, this graph enables you to analyze how an increase in physical I/O requests affects queue length.
See “Focusing Focusing on information in overtime graphs” on page 32graphs.
About the Statement and Batch entities Association area
The following tabs are displayed in the Association area of the Statement and Batch entities:
...
The Actual Plan column displays if the plan for statement or batch is an actual plan. This is available for SQL Server 2005 only.
About viewing performance data for Statement and Batch entities
The following table describes the additional information displayed in the Performance tab in the Association area.
Table 6- 5 Information displayed in the Performance tab
| Column |
|---|
...
| Description |
|---|
...
 |
...
Click to launch the SQL tab with the selected entity, to continue your analysis of the selected statement or batch. When launching to the SQL tab from a batch entity, the launch is performed in the context of the batch that has the latest explain statement performed on it. |
| Entity |
...
| Name | Displays the name of the entity (statement or batch). |
| In MS- |
...
| SQL | Displays entity resource consumption (default: stacked bar chart) and shows entity breakdown, over the selected time period. |
| % |
...
| Displays the percentage of the total In MS-SQL. |
| Statement |
...
| Executions | Number of statements executed within the selected time period by the selected entity. |
| Statement Duration (Avg) |
...
| Average duration for a single statement, in the selected entity, during the selected time period, calculated by dividing the Statement Duration by the number of executions. | |
| Text |
...
| Displays the statement's text (formatted for easy readability). |
About viewing In MS-SQL information for Statement and Batch entities
The In MS-SQL tab contains the In MS-SQL counter and the breakdown of the In MS-SQL into its states. The In MS-SQL is displayed with a normalized view while all the other counters display the time each state was consumed.
About viewing Statistics information for Statement and Batch entities
The following table describes the additional information displayed in the Statistics tab in the Association area.
Table 6- 6 Information displayed in the Statistics tab
| Column |
|---|
Column Description
...
| Description | |
|---|---|
| Click to launch the SQL tab with the selected entity, to continue your analysis of the selected statement or batch. |
| Entity Name (such as Statement) |
...
| Displays the name of the entity. | |
| CPU |
...
| Time | Cumulative CPU time for the entity during the selected time period. |
| Physical I/O |
...
| Operations | Total number of physical I/O requests performed by the selected entity during the selected time period. |
| Parallel Sessions (Min) |
...
Minimum number of threads used to execute the statement or batch in parallel. This counter is calculated from the ecid column in sysprocesses. This enables you to verify that SQL Server is using the best execution plan for the current statement. | |
| Parallel Sessions (Max) |
...
| Maximum number of threads used to execute the statement or batch in parallel. This counter is calculated from the |
...
ecid column in sysprocesses. This enables you to verify that SQL Server is using the best execution plan for the current statement. |
About viewing Procedure Cache information for Statement and Batch entities
The Procedure Cache is the part of the SQL Server memory pool that stores execution plans for batches, stored procedures and triggers. Detailed information on the execution plan run of a specific statement, collapsed statement, batch or collapsed batch is displayed in the Procedure Cache tab.
The following table describes the information displayed for execution plans in the Procedure Cache tab
Table 6- 7 Information displayed in the Procedure Cache tab
| Column |
|---|
...
| Description |
|---|
Entity name (such as Instance, Database) |
...
| Displays the name of the entity. | |
| Elapsed |
...
| Time | Amount of time it took to complete the executions of the plan. |
| Execution |
...
| Count | Number of times the plan was executed. |
| Avg |
...
| Duration | Average amount of time it took to execute the plan, calculated as total elapsed time divided by the execution count. |
| Recompilations |
...
| Number of times a plan was recompiled while it remained in the procedure cache. |
| CPU |
...
| Time | Amount of CPU time consumed by the executions of the plan. |
| CLR |
...
| Time | Time consumed inside CLR objects by the executions of the plan. |
| Logical I/ |
...
| O | Number of logical reads and writes performed by the executions of the plan. |
| Physical |
...
| Reads | Number of physical reads performed by the executions of the plan. |
About viewing Plan information for Statement and Batch entities
The following table describes the additional information displayed in the Plan tab in the Association area.
Table 6- 8 Information displayed in the Plan tab
| Column |
|---|
...
| Description |
|---|
...
|
...
Click to launch the SQL tab with the selected entity, to continue your analysis of the selected statement or batch. Explain data for the statement will be in extrapolated context to the batch. |
| Entity Name ( |
...
| Such as Statement) |
...
| Displays the name of the entity. | |
| Database |
...
| Identifies the database on which the statement or batch is run. |
| User |
...
Displays one of the SQL Server users by whom this statement was executed. If this statement is not part of a stored procedure, this is the user that will be used as the parsing user when explaining this batch. |
| Most Recent |
...
| Plan | Indicates the last time the access path of the statement or batch was changed. |
| Last Show |
...
| Plan | Indicates the last time the statement or batch was explained. |
| Cost |
...
| Indicates the total estimated cost of the statement's or batch's execution. |
| Table |
...
| Scan | Indicates whether a table scan was performed in the execution plan (applicable to Statement entity only). |
| Clustered Index |
...
| Scan | Indicates whether a clustered index scan was performed in the execution plan (applicable to Statement entity only). |
...
| clustered Index Seek | Indicates whether a clustered index seek was performed in the execution plan (applicable to Statement entity only). |
| Index |
...
| Scan | Indicates whether an index scan was performed in the execution plan (applicable to Statement entity only). |
| Index |
...
| Seek | Indicates whether an index seek was performed in the execution plan (applicable to Statement entity only). |
| Bookmark |
...
| Indicates whether a bookmark operation was performed in the execution plan (applicable to Statement entity only). |
| Sort |
...
| Indicates whether a sort operation was performed in the execution plan (applicable to Statement entity only). |
| Merge |
...
| Join | Indicates whether a merge join operation was performed in the execution plan (applicable to Statement entity only). |
| Hash |
...
| Join | Indicates whether a hash join operation was performed in the execution plan (applicable to Statement entity only). |
...
| Nestled Loops Join | Indicates whether a nested loops join operation was performed in the execution plan (applicable to Statement entity only). |
| Parallel |
...
| Access | Indicates whether a parallel access operation was performed in the execution plan (applicable to Statement entity only). |
| Show Plan |
...
| Error | Shows the error that occurred during the last explain process. |
About the Collapsed statement and collapsed batch entities Association area
The following tabs are displayed in the Association area of the Collapsed Statement and Collapsed Batch entities:
...
Clicking a tab shows additional information on the entities displayed in the Association area table. The rows of the table remain the same; the columns change to display additional details on the entities listed in the table. The information displayed in each tab is described below.
About viewing performance data for Collapsed Statement and Collapsed Batch entities
The following table describes the additional information displayed in the Performance tab in the Association area.
Table 6- 9 Information displayed in the Performance tab
| Column |
|---|
...
| Description |
|---|
| Entity |
...
| Name | Displays the name of the Collapsed Statement or Collapsed Batch. |
| In MS- |
...
| SQL | Displays entity resource consumption (default: stacked bar chart) and shows entity breakdown, over the selected time period. |
| % |
...
| Displays the percentage of the total In MS-SQL. |
| Occurrences |
...
| Number of different statements possessing the selected collapsed form. |
| Statement |
...
| Executions | Number of statements executed within the selected time period by the selected entity. |
| Statement Duration (Avg) |
...
| Average duration for a single statement, in the selected entity, during the selected time period, calculated by dividing the Statement Duration by the number of executions. | |
| Text |
...
| Displays the statement or batch text (formatted for easy readability), in the collapsed form. |
About viewing In MS-SQL data for Collapsed Statement and Collapsed Batch entities
This tab contains the In MS-SQL counter and the breakdown of the In MS-SQL into its states. The In MS-SQL is displayed with a normalized view while all the other counters display the time each state was consumed.
About viewing Statistics data for Collapsed Statement and Collapsed Batch entities
The following table describes the additional information displayed in the Statistics tab in the Association area.
Table 6- 10 Information displayed in the Statistics tab
| Column |
|---|
...
| Description |
|---|
| Entity Name (such as Collapsed Statement) |
...
| Displays the name of the entity. | |
| Database |
...
| Identifies the database on which the collapsed statement or batch is run. |
| CPU |
...
| Time | Cumulative CPU time for the entity during the selected time period. |
| Physical I/O |
...
| Operations | Total number of physical I/O requests performed by the selected entity over the selected time period. |
| Parallel Sessions (Min) |
...
Minimum number of threads used to execute the statement or batch in parallel. This counter is calculated from the This enables you to verify that SQL Server is using the best execution plan for the current statement. | |
| Parallel Sessions (Max) |
...
Maximum number of threads used to execute the statement or batch in parallel. This counter is calculated from the This enables you to verify that SQL Server is using the best execution plan for the current statement. |
About viewing Procedure Cache data for Collapsed Statement and Collapsed Batch entities
The Procedure Cache is the part of the SQL Server memory pool that stores execution plans for batches, stored procedures and triggers. Detailed information on the execution plan run of a specific instance is displayed in the Procedure Cache tab.
The following table describes the information displayed for execution plans in the Procedure Cache tab.
Table 6- 11 Information displayed in the Procedure Cache tab
| Column |
|---|
...
| Description |
|---|
| Entity name (such as Instance, Database) |
...
| Displays the name of the entity. | |
| Elapsed |
...
| Time | Amount of time it took to complete the executions of the plan. |
| Execution |
...
| Count | Number of times the plan was executed. |
| Avg |
...
| Duration | Average amount of time it took to execute the plan, calculated as total elapsed time divided by the execution count. |
| Recompilations |
...
| Number of times a plan was recompiled while it remained in the procedure cache. |
| CPU |
...
| Time | Amount of CPU time consumed by the executions of the plan. |
| CLR |
...
| Time | Time consumed inside CLR objects by the executions of the plan. |
| Logical I/ |
...
| O | Number of logical reads and writes performed by the executions of the plan. |
| Physical |
...
| Reads | Number of physical reads performed by the executions of the plan. |
About Session and Blocker Session entities
The Session entity displays performance, statistics and locking information on the selected session. This entity differs from other entities in the Activity tab in that session information is retrieved from the Collector's temporary files and not from the PMDB.
...
- Overview
- In MS-SQL
- Locking
- Internal Waits
- Overall Activity
About getting an overview of Session and Blocker Session entities
The Overview displays general details on the selected session or blocker session, such as, Machine, Login, and Client Process ID. A breakdown of the selected session's or blocker session's resource consumption breakdown is also displayed.
About viewing In MS-SQL data for Session and Blocker Session entities
The In MS-SQL view displays the resource consumption of the selected session over the selected time period. This graph enables you to analyze performance trends for the session, over time.
| Info |
|---|
...
The graph displays data in time slices. |
See “About session states” on page 36 and “Focusing See About session states and Focusing on information in overtime graphs” on page 32graphs.
About viewing Session and Blocker Session Locking
The Locking view displays the blocking tree and lock wait duration broken down into lock levels (such as, Table, Page, and Key), for the selected session, within the specified time period. The following information is displayed:Locks Displays
- Locks. Displays which sessions were involved in a blocking situation (either locking or blocking). It is important to understand which sessions are involved in each blocking chain, as there may be several sessions involved at the same time. It is then important to determine which session is blocking others, which object is being blocked, and what type of lock has been applied.
A yellow lock indicates that the session is currently blocking other sessions but is not itself blocked.
A red lock indicates the session is currently blocked by another session. Note that a session may also block other sessions while being blocked by a different session. - Lock wait
...
- graph. The Lock Wait graph shows a breakdown of the Lock Waits, and when they occurred, over the selected time period.
| Info |
|---|
...
The graph displays data in time slices. |
About the lock tree structure
To gain a better understanding of the lock tree let's take a look at its structure. Notice that the session located in the root of each chain is the session that blocks all others. Each session directly blocks all sessions positioned one level beneath it.
...
Every time a change occurs, a new lock tree is opened, as for example, when a new session enters into the lock. It is therefore possible that there will be sub-trees of several locks that may appear identical. See “Focusing Focusing on information in overtime graphs” on page 32graphs.
About viewing internal waits for session and blocker session entities
The Internal Waits view displays the following internal waits, indicating that the session is waiting for an internal resource to be freed:
- Other internal
...
- wait. Aggregates the following types of waits:
- Full text waits
- HTTP waits
- Query notifications
- Backup
...
- wait. Includes the wait type that commonly occurs when a Backup command is performed.
- Memory
...
- wait. Includes ten types of waits that indicate that a session is waiting for memory to be allocated to it.
- Profiler
...
- wait. Aggregates a number of states associated with the SQL Profiler and lets you see how much of the database resources it consumes.
- DB mirror
...
- wait. Aggregates the new waits that occur when DB mirroring is performed, such as the waits that occur if the communication layer used by DB mirroring becomes backlogged.
- DTC
...
- wait. Aggregates waits that occur when Distributed Transaction Coordinator sessions have to wait for each other.
- Parallel
...
- wait. The session is waiting for one of its sub-threads to complete its operation.
- Latch
...
- wait. The session is waiting for an internal lock to be released.
- Buffer pool
...
- wait. Groups together the events that show contention on pages in the buffer pool.
About viewing overall activity for Session and Blocker Session entities
The Overall Activity view displays the duration of the activity performed by the selected session within the specified time period, broken down into the following components:
- Waitfor Command—the Command. The amount of time applications were waiting because they were waiting for command.
- Parallel Exchange Wait—the Wait. The amount of time the thread in a parallel session is waiting for data exchange from another thread.
- Request Wait—the Wait. The amount of time applications were in a request wait state, defined as the state wherein the server is waiting for a client request.
- In MS-SQL—represents SQL. Represents total amount of time spent in SQL Server.
| Info |
|---|
...
The graph displays data in time slices. |
See “Focusing Focusing on information in overtime graphs” on page 32graphs.
About the Session and Blocker Session entities Association area
The following tabs are displayed in the Association area of the Session and Blocker Session entities:
...
Clicking a tab shows additional information on the entities displayed in the Association area table. The rows of the table remain the same; the columns change to display additional details on the entities listed in the table. The information displayed in each tab is described below.
About viewing Performance data for Session and Blocker Session entities
The following table describes the additional information displayed in the Performance tab in the Association area.
Table 6- 12 Information displayed in the Performance tab
| Column |
|---|
...
| Description |
|---|
...
| SPID |
...
| Displays the system process ID. The SPID is a unique integer assigned to each user connection when the connection is made. |
| Program |
...
| Displays the program that opened the session. |
| In MS- |
...
| SQL | Displays entity resource consumption (default: stacked bar chart) and shows entity breakdown, over the specified time period. |
| Database |
...
| Displays the database used by session. |
| Login |
...
| Displays the SQL Server or Windows login that opened the session. |
| Start |
...
| At | Displays the session's login time. |
| Completed |
...
| At | Displays when the session was completed, within the selected time period. |
| Machine |
...
| Displays the machine the program ran on. |
| Work |
...
| Type | Displays the group the session is related to, such as User Application or SAP Dialog. |
| User |
...
| Displays the database user that opened the session. |
| Duration (Summed) |
...
| Displays the time that has elapsed since the login time. | |
| Client Process |
...
| ID | Displays the process ID of the program. |
About viewing In MS-SQL data for Session and Blocker Session entities
This tab contains the In MS-SQL counter and the breakdown of the In MS-SQL into its states. The In MS-SQL is displayed with a normalized view while all the other counters display the time each state was consumed.
About viewing Statistics data for Session and Blocker Session entities
The following table describes the additional information displayed in the Statistics tab in the Association area.
Table 6- 13 Information displayed in the Statistics tab
| Column |
|---|
...
| Description |
|---|
...
| SPID |
...
| Displays the system process ID. The SPID is a unique integer assigned to each user connection when the connection is made. |
| CPU |
...
| Time | Cumulative CPU time for the entity over the selected time period. |
| Physical I/O |
...
| Operations | Total number of physical I/O requests performed by the selected session over the selected time period. |
| Memory |
...
| Usage | Displays the memory consumed (in MB) by the selected session over the selected time period. |
| Open |
...
| Transactions | Displays the number of transactions that were opened by the selected session over the selected time period. |
See “About session states” on page 36See About session states.
About the Locked Object entity
The Locked Object displays the time each object was locked. The collector determines that an object is locked according to its lock type and lock resources. The following lock types are displayed:
Table 6- 14 Lock types
| Type |
|---|
...
| Description |
|---|
...
| Database |
...
| Lock on the entire database. |
| Row |
...
| In Table | Lock on rows in the table. |
| Key |
...
| In Index | Lock on rows within the index. |
| Page of Database |
...
| File | Lock on pages in the database file. |
| Extent of Database |
...
| File | Lock on extents in the database file. |
| Table |
...
| Lock on the entire table's data and indexes. |
...
| Application | Lock on application resource. |
| Compile of Stored |
...
| Procedure | Lock on stored procedure. |
| Compile of |
...
| Trigger | Lock on stored trigger. |
| Compile of |
...
| Function | Lock on stored function. |
| Index Database |
...
| File | Lock on the entire index. |
| Unknown |
...
| Precise for SQL Server is not able to identify the lock type. |
| Info |
|---|
...
If the Collector identifies a blocking situation but is not able to identify the lock type and lock resource, then the sum of the wait on all locked objects will not be identical to the lock wait of the parent. |
About getting an overview of a Locked Object
The Locked Object view displays the locked Object Name, Lock Type, and the Lock Wait Duration graph, over the selected time period, as follows:Properties Displays
- Properties. Displays the locked object's full name and lock type. For example, if the locked object's type is Table, the name will also include the database and owner of the table.
- Lock
...
- Wait. Displays the lock wait duration of the selected locked object, over the selected time period.
About Table and Index entities
The Table and Index entities display performance information regarding the selected table or index. Object performance is measured by how much the object contributes to the performance of the statements accessing the object. The contribution is calculated by multiplying the cost of the operation(s) that access the object (in percentage) with the In MS-SQL time of the statement. The sum of the results of all statements accessing the object represents the performance of the object. The I/O wait time of an object is calculated in the same way.
The following views are available:
- Overview
- Performance
About getting an overview of Table and Index entities
The Overview displays general details regarding the Table or Index such as which database the table exists in, who is its owner and the amount of time it spent in SQL Server, broken down into its index and table components, as follows:Properties Displays
- Properties. Displays the following table or index identifiers: Database, Table Owner, and Table name, and index name (if the entity is an index).
- In MS-SQL access breakdown
...
- . Displays the estimated resource consumption resulting from accessing the table and its indexes in a Table entity and estimated resource consumption resulted from accessing the index in an Index entity.
About viewing Table and Index performance
The Performance view displays the estimated In MS-SQL duration versus the I/O waits for the selected Table or Index over the selected time period, as follows:
- In MS-
...
- SQL. This graph displays the estimated In MS-SQL for the Table or Index over the selected time period. When the selected entity is a table, the graph shows the breakdown of both the Table and index In MS-SQL duration. When the selected entity is an Index, only the portion for the selected index is displayed.
- I/
...
- O. This graph displays the estimated I/O wait duration resulting from accessing the Table or Index over the selected time period. When the selected entity is a table, the graph shows the breakdown of both the Table and index I/O wait duration. When the selected entity is an Index, only the information for the selected index is displayed.
About the I/O Entity
The I/O entity displays the I/O wait duration logged for the selected entity. The I/O entity can be a logical file or a storage device.
About the I/O entity Overview view
This view displays general information regarding the I/O entity. For example, for a Logical file entity the information displayed is: Logical File, File Database and Physical File name (including the path). In addition, the I/O wait duration over the selected time period is displayed.How the
| Anchor | ||||
|---|---|---|---|---|
|
You can identify a performance problem by doing one or more of the following:
- Examining resource consumption of an entire instance and database
- Identifying heavy resource consumers
- Examining resource consumption over time
- Examining I/O waits of different storage devices connected to an a SQL Server instance
- Correlating SQL Server data with ERP/COM+ data
- Examining locking over time of a database entity
- Identifying offending SQL statements
- Identifying resource-consuming collapse statements or batches
- Examining the availability of an instance and database
- Examining the scalability of your application or SQL servers
- Identifying tempdb contentions
| Anchor | ||||
|---|---|---|---|---|
|
When performing a tuning audit it is very important to analyze and understand the performance behavior of your instances and databases. You may have already drilled down to analyze the performance of a single query or program. However, examining the entire instance's behavior can alert you to the health of your system. The Instance (or Database) represents the performance of the average application. This helps you answer questions such as: "This query suffers from Log wait, but does the entire system suffer from lock wait?" If, for example, you discover that your system suffers from I/O wait and you tune a query that performs memory operations, you most likely will not improve the entire system's I/O wait problem. So examining the entire instance can provide a quick overview of the dominant resources consumed.
...
- In the Instance list, choose the item you want to analyze.
- In the Time Frame list, choose the period of time you want to analyze.
- On the View controls in the Main area, click Overview. Examine the entire instance and determine which are the dominant resources that are consumed by your system.
- On the Association controls in the Association area, click Databases.
- On the Performance tab, place the cursor in the In MS-SQL column of the top database and view the information displayed on its resource consumption.
| Info |
|---|
...
As a rule of thumb, a healthy system should have a high Using CPU value, a 10–15% I/O Wait, a Log Wait based on the nature of the application, and the remaining states should show values that are as minimum as possible. |
| Anchor | ||||
|---|---|---|---|---|
|
Precise for SQL Server enables you to drill down to application components (such as Logins, Databases, Programs, Machines, and Statements) to determine which application component consumes the most resources. This is accomplished by clicking on an application component in the Association area. This process is iterative and you may continue to drill down until you discover the application component that you want to tune.
...
- In the Instance list, choose the item you want to analyze.
- In the Time Frame list, choose the period of time you want to analyze.
On the View controls in the Main area, click In MS-SQL to view a breakdown of the In MS-SQL time.
Note:Info One of the components of In MS-SQL time that you can observe in the In MS-SQL graph is Internal Wait. You can view additional information on that particular component, over the selected time frame, by clicking Internal Waits on the View controls in the Main area. This view lets you analyze a breakdown of the Internal Wait parameter and determine which internal wait parameter is consuming the most time and resources.
- On the Association controls in the Association area, click Programs.
- On the Performance tab, place the cursor in the In MS-SQL column of the top program entity and view the information displayed regarding its resource consumption.
- Drill down on the entity to focus on additional components.
- Go back to the overview of the instance you originally selected.
- In the Association area, use the Association controls to select different entities associated with the instance, and analyze the average duration of each entity.
| Anchor | ||||
|---|---|---|---|---|
|
When you analyze and tune the performance of an application component (such as, database, program, or query) it is important to take into consideration its performance over time. Precise for SQL Server allows you to easily view the component's performance over a selected time period.
...
- In the Instance list, choose the item you want to analyze.
- In the Time Frame list, choose the period of time you want to analyze.
- On the View controls in the Main area, click In MS-SQL.
- Move the cursor over the bars in the graph to view the instance's resource consumption over time.
| Anchor | ||||
|---|---|---|---|---|
|
If you have determined that the application is suffering from I/O waits, you may want to examine how the I/O waits are divided amongst the various storage devices. You will want to balance the I/O waits among all the storage devices.
...
- In the Instance list, choose the item you want to analyze.
- In the Time Frame list, choose the period of time you want to analyze.
- On the View controls in the Main area, click In MS-SQL.
- On the Association controls in the Association area, click Storage Devices.
- Observe the I/O waits for each storage device unit.
- If you locate storage devices suffering from I/O waits, you can check which logical files reside on the storage device and move a few to a different storage device. Drill down from the storage device and analyze the Logical Files entities. Once you have identified which logical file(s) should be moved to a different storage device, check the I/O pattern on that storage device, to ensure that the move will not cause the I/O pattern on the new storage device to deteriorate.
| Anchor | ||||
|---|---|---|---|---|
|
Certain obstacles make it difficult to investigate ERP data in the SQL Server Tier. Most activity is registered in SQL Server under generic names. For example, in SAP, all activities are listed under a single login (SAP\SAPServiceSQ1) and some generic program names (R3D01(1)sp crea OLEDB).
...
The following table shows the benefits of installing the Precise for SQL Server Interpoint extension.
Table 6- 15 Benefits of the Precise for SQL Server Interpoint extension
| Type of |
|---|
...
| Application | Benefit |
|---|---|
| SAP | Drill down to the most resource-consuming SAP transaction, SAP user, SAP work type, and SAP application server name. |
| PeopleSoft |
...
| Identify the most resource-consuming PeopleSoft Client Machines, PeopleSoft User IDs, Tuxedo OS Users, Tuxedo domains, and work types. |
| Siebel |
...
| Identify the most resource-consuming Siebel business object, Siebel application, Siebel component, and Siebel server. |
| COM+ |
...
| Determine the most resource-consuming COM+ application, COM+ component, COM+ method, and COM+ interface. |
To correlate SQL Server data with ERP/COM+ data
- In the Instance list, choose the item you want to analyze.
- In the Time Frame list, choose the period of time you want to analyze.
- On the Association controls in the Association area, click Siebel View/Programs.
- Drill down to the entity whose data you want to correlate.
- On the View controls in the Main area, click In MS-SQL.
- Move the cursor over the instance heading to correlate SQL Server information with ERP information
| Anchor | ||||
|---|---|---|---|---|
|
While many think that locking is bad, the truth is that locking is good—it maintains data integrity. The situations to avoid are contentions. Contentions are situations in which one application waits for a resource that is being held by another application.
...
- Look at the Overview view of your instance (database, program) to understand the percentage of Lock Wait your application suffers.
- Examine the Lock Wait over a selected time period. By examining resource consumption over time you can identify if Lock Wait occurred all the time, or only on specific dates.
- Try to gain an understanding of the Lock types your applications were blocked on. An overtime graph of the different Lock types can be displayed in the Locking view.
- Examine the locked objects. You can display a list of all locked objects and compare them according to lock time.
- Once you have identified all of the above, you also need to assess who is blocking who. For example, you will need to determine which session is blocking which session? . The locks tree displays all the contentions that occurred and shows which sessions were involved in contentions.
...
- In the Instance list, choose the item you want to analyze.
- In the Time Frame list, choose the period of time you want to analyze.
- In the Association area drill down to the database entity you want to analyze.
- On the View controls in the Main area, click Locking.
- Examine the locking of the selected entity in the graph, for the period of time you selected. Move the cursor over the bars in the graph to view the Lock Wait breakdown (such as, table locks, row locks, page locks, key locks and other, in addition to total Lock Wait time for the selected time slice). Examine the locks tree to observe all the contentions that occurred and determine sessions were involved in contentions.
- On the Association controls in the Association area, click Locked Objects.
| Anchor | ||||
|---|---|---|---|---|
|
Having identified a major resource-consuming entity, you can further drill down to the statements and batches executed by that entity. These may include long running SQL statements and SQL statements that use few resources but were executed frequently.
...
- View which entities executed the statement.
- View resources consumed by the statement, which enables you to determine if the statement is CPU or I/O bound, waiting for a lock, etc.
- View resource consumption patterns, which allow you to observe if the statement execution is affected by excessive use of the same resource by another statement.
- Tune the statement in the SQL tab.
To identify offending SQL Statements
- In the Instance list, choose the item you want to analyze.
- In the Time Frame list, choose the period of time you want to analyze.
- In the Association area, drill down to the top resource-consuming database.
- On the Association controls in the Association area, click Statements. On the Performance tab view which entities executed the statement and view the resources consumed by the statement.
- On the Plan tab, in the Association area, view a summary of the statement's access plan.
| Anchor | ||||
|---|---|---|---|---|
|
Many statements may look the same but differ in their literals. When you want to identify the most resource-consuming statements you would want to treat them as the same statement. Precise for SQL Server lets you identify the most resource-consuming collapsed statements or batches.
...
If you observe different performance patterns for the same statements you can also examine the distribution of their execution plans. If they have different execution plans this may explain the different performance patterns.
| Info |
|---|
...
The batch hash value for a collapsed batch in a stored procedure is calculated according to the header or definition. This lets you can observe the performance of a batch over time, even if changes were made to a statement in the batch. |
To identify resource-consuming collapse statements or batches
- In the Instance list, choose the item you want to analyze.
- In the Time Frame list, choose the period of time you want to analyze.
- On the Association controls in the Association area, click Statements (Collapsed).
- Drill down to the top resource-consuming collapsed statement.
- On the Performance tab in the Association area, examine the different statements having the selected collapsed form to examine the performance of each individual instance.
- On the Association controls in the Association area, click Plans to analyze the various access plans of the collapsed statement you selected.
| Anchor | ||||
|---|---|---|---|---|
|
Since Because Precise for SQL Server maintains a constant connection with your SQL Server instance, it can easily report on the availability of the instance and databases.
The availability report displays the percentage of time the instance was up and the amount of time the instance was unavailable, over the selected time period.
| Info |
|---|
...
This view is accurate only if the Precise for SQL Server collector is up and running. |
To examine the availability of an instance and database
- In the Instance list, choose the instance you want to analyze.
- In the Time Frame list, choose the period of time you want to analyze.
- On the View controls in the Main area, click Availability.
- Move the cursor over the Availability graphs and Unavailability Times graphs to observe how often the instance was available during the selected time period.
| Anchor | ||||
|---|---|---|---|---|
|
Applications are called upon to support the addition of more and more users, and data, over the years. One of today's tasks is ensure that our application and servers are scalable for tomorrow's tasks. Precise for SQL Server enables you to examine if the application is scalable, or if the SQL servers are scalable.
...
- In the Instance list, choose the item you want to analyze.
- In the Time Frame list, choose the period of time you want to analyze.
- On the View controls in the Main area, click Scalability.
- In the Session Duration (Avg) vs. Sessions graph, observe the number of sessions and the impact of the average session duration, over the selected time period. For example, if you observe that average session duration increases when the number of sessions decrease, this may indicate that the application has a scalability problem.
- On the View controls in the Main area, click System System Scalability.
- Analyze the In MS-SQL vs. SQL Server CPU usage graph to determine if SQL Server CPU consumption growth affects the server CPU consumption and I/O wait times. Check the Physical I/O Operations vs. Queue Length graph to determine if a growth in I/O requests increases the time I/Os have to wait in the queue to be served.
| Anchor | ||||
|---|---|---|---|---|
|
Tempdb is the most heavily shared resource across the entire instance and can affect the performance of all applications. It is therefore important to monitor its usage. A high tempdb wait value may indicate a bottleneck in tempdb.
...
- In the Instance list, choose the item you want to analyze.
- In the Time Frame list, choose the period of time you want to analyze.
- On the View controls in the Main area, click In MS-SQL to view a breakdown of the In MS-SQL time. Check the Tempdb Wait Time component of the In MS-SQL counter.
- On the Association controls in the Association area, click Programs.
- On the Performance tab, place the cursor in the In MS-SQL column of the top program entity and check which portion of resource consumption can be attributed to tempdb wait.
- Drill down on the entity to focus on additional components.
Precise. Performance intelligence from click to storage. Learn more > >
...
...