Page History
...
Table 2-1 Precise for SQL Server tabsTab Description
Dashboard Allows
| Tab | Description |
|---|---|
| Dashboard | Allows you to quickly identify which SQL Server instance has a performance problem, providing the first glimpse into where the problem lies. |
...
| Current | Allows you to solve the performance problems that are happening now. |
...
| Activity | Allows you to examine application performance over time and helps locate performance bottlenecks. |
...
| Objects | Allows you to identify which SQL Server objects are used inefficiently by the application, and their effect on the application components. |
| Statistics |
...
| Allows you to identify performance bottlenecks in the way SQL Server instance resources are used. |
...
| SQL | Allows you to tune problematic SQL statements or stored procedures. |
| Maintenance |
...
| Displays information on SQL Agent activities and other SQL Server activities related to DBA. |
...
| maintenance tasks. |
| SmarTune |
...
Displays performance findings that may indicate potential problems in the instance. The list of problems includes the following: |
...
|
...
|
...
|
How most tabs are structured
Though each tab is structured differently, most tabs consist of two different areas. Each area can include different control elements, such as tabs and view controls, and displays information in various formats, such as tables, graphs, or charts. The various areas are related to each other in that performing an action in one area affects the information displayed in other areas on the page. For example, the Current tab contains an upper and a lower area. The lower area (Association area) shows information in a table format. Each row in the table represents an application. The upper area (Main area) displays general information on the selected entity as well as related applications.
...
Figure 2-1 How a typical tab is structured
About the Precise bar
The Precise bar enables you to keep track of where you have been and provides various controls. The following table describes the function of each of the toolbar buttons.
Table 2-2 Precise bar functions
...
| Icon | Name | Description |
|---|---|---|
 | Back | During a work session, keeps track of where you have navigated to. The Back and History buttons enable you to navigate between previously visited views. The Back control displays your previous view. |
...
 | Forward | Enables you to navigate to the next view. This button is only enabled if you clicked Back or if you chose a history option. |
...
 | AdminPoint | Opens Precise AdminPoint. |
...
 | Home | Navigates to the highest level entity, usually the instance or Tier (all instances). The time frame settings remain the same. |
...
 | Stop | Stops a request for information from the server. |
...
 | Refresh | Updates the data currently displayed. |
...
 | Favorites | Enables you to add or remove favorites in your Favorites list. |
...
 | Send | Opens a new email message in your email program with the link to the current application in context. |
...
 | Settings | Opens the General Settings and Time Frame Settings dialog boxes. |
...
 | Help | Opens the online help in context. |
About the Main area
The Main area displays general information on the selected entity. The structure of this area depends on the selected entity and tab.
...
In some tabs, you can filter the contents of the view by clicking the Filter button. See “Filtering data” on page 30.
About the Association area
The Association area lists entities that have similar attributes and that are related to the selected entity named in the Tab heading. Besides the Tab bar, the Association area is the main navigation tool. It enables you to drill down from one entity to related entities (usually of a different type).
...
The following icons are used to indicate which format information is displayed.
 Displays the information in numerical format.
 Displays the information in a bar graph.
 Displays the information as a stacked bar graph.
 Displays the information in percentage format
...
See “Filtering data” on page 30 and “Associating entities with data that meets specific criteria” on page 30.
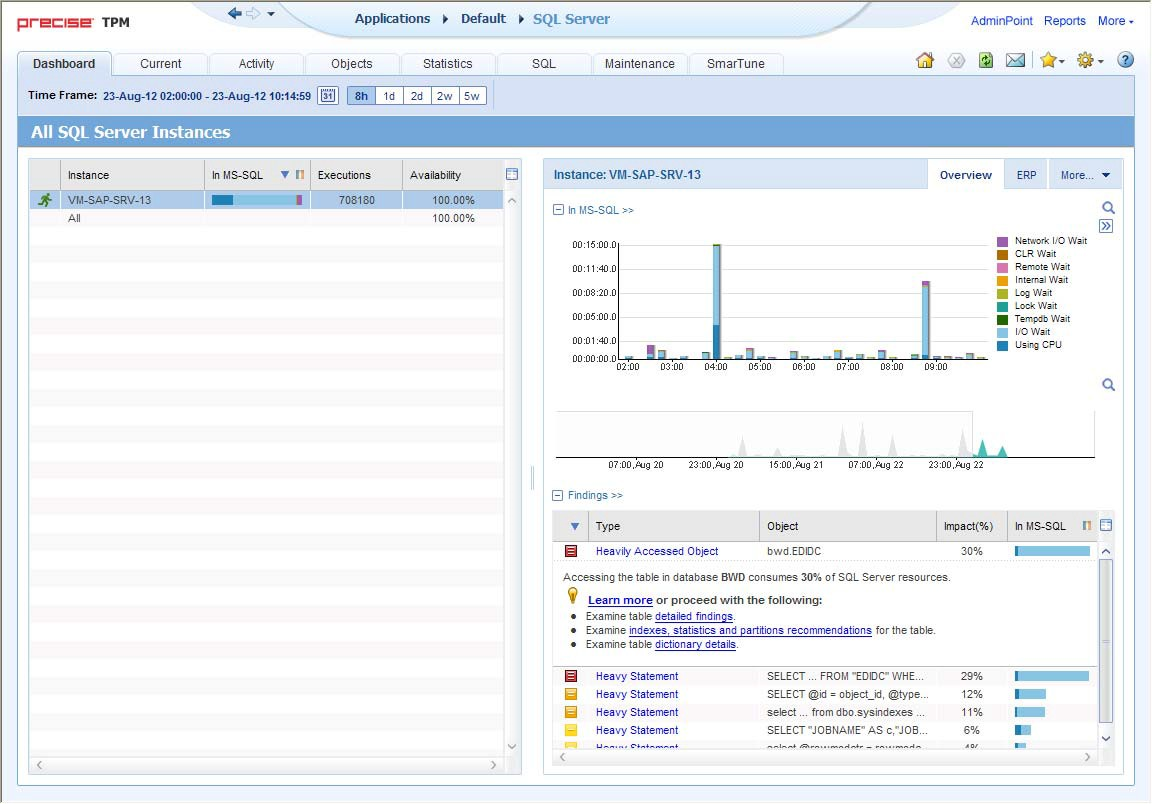
About the Findings area
For selected tabs in Precise products, the association area includes the Findings area, displaying problematic findings for the application. The findings feature is a high level tool, designed to provide the user with an overview of performance issues within the monitored application and enable quick and efficient navigation to the relevant tab for further analysis and handling. The displayed performance findings may indicate performance deterioration as well as incorrect methods usage. Each finding appears as a row in the displayed table of findings. Hover the mouse indicator over the single-line displayed finding to expand the finding. When expanded, the finding details area provides important guidelines as to what may be the root cause for the reported problem, and what the recommended steps are to resolve this problem.
...
Table 2-3 Information displayed in the Findings area
Column Description
Severity The severity of the finding is calculated using a formula. The position of the finding in the list is determined by an internal scoring system that is based on the knowledge of Precise product experts. The severity is indicated by the following colors:
• Red: High severity
• Orange: Medium severity
• Yellow: Low severity
• Blue: No severity - the finding is strictly informative
By default, findings are displayed according to severity.
Finding A short name of the Finding.
Context Entity/Method name (unless specified for the whole instance). The entity/method name is a short name but the long name is displayed in the ToolTip.
Some of the findings are identified in specific Methods while others are relevant for the entire instance. In the latter case, a finding is specified as an instance-related finding.
Note: Rows are aggregated by finding and the URI/method/SQL name and not by ID.
Finding overview Displays specific details regarding the finding in context.
Note: This is displayed in the expanded view only.
Learn more (advice) Provides recommendations for solving the selected finding. For each finding, it lists all relevant pieces of advice and all applicable solutions. You should carefully review all data for the finding and then choose the advice that best suits your needs.
Note: This is displayed in the expanded view only.
Proceed with the following (bullets) Provides expert knowledge about the selected finding. The information displayed will direct you if you have difficulties deciding which advice to take or which solution to implement.
Note: This is displayed in the expanded view only.
...