Page History
...
The Scheduling dialog box includes the following options:Once Run
- Once. Run only once in the selected date and time.
...
- Hourly. Run every hour at the specified minute, starting at the specified date.
...
- Daily. Run once a day at the specified time, starting at the specified date.
...
- Weekly. Run once a week at the specified day of the week and time, starting at the specified date.
...
- Monthly. Run once a month at the specified day of the month and time, starting at the specified date.
...
- Never. Never run the report.
To set the schedule of a report generation1. From
- From the Reports Table, select the report and click Scheduling.
...
- Set the schedule for the selected report and click OK.
| Anchor | ||||
|---|---|---|---|---|
|
...
To create a copy of a selected report1. From
- From the Reports Table, select the report and click Save As.
...
- In the Report Name field, type a new name for the report copy.
...
- From the Tier list, select the Tier for which you want to assign the report copy.
You can assign the report copy either to the Tier of the original report or to the Cross-Tiers.
...
- From the Set list, select the report set for which you want to include the report copy.
If you have selected the Tier of the original report in the previous step, you can include the report copy either to the original report set or to the Customized set.
...
- Click OK.
| Anchor | ||||
|---|---|---|---|---|
|
...
To create customized reports1. On
- On the Command buttons, click New.
...
- Define a query.
...
- Run and design a customized report.
After creating a customized report, you can modify and redesign it. See Editing an existing customized report on page 26.
Defining a query statement
Each report can execute multiple queries that determine the customized report data. A query definition - whose result is an SQL SELECT statement - includes the following elements:
- Summary
...
- level. Specifies the granularity level of the data: time slice, hourly, daily, weekly, and monthly.
- Report
...
- fields. Specifies the fields selected from the Data Tree to be included in the report.
...
- Filter. Specifies the filtering conditions that determine the data in the report.
You can add, rename, or remove queries using the buttons located to the right of the Query Selection box, in the customized report data selection page.
Table 3-1 Query 1 Query selection icons
Icon Description
...
| Icon | Description |
|---|---|
 | Click to add a new query. |
...
 | Click to rename an existing query. |
 |
...
| Click to remove an existing query. |
To define a query statement:1. Set
- Set the summary level of your query. From the Summary Level box, select the view level for your report.
The Performance Management Database stores data in different levels of granularity: Time slice, Hourly, Daily, Weekly, and Monthly. This enables you to present a detailed view and progressively higher-level view of the same data in your customized report.
...
- Select the fields you want to view in your report. The Data Tree on the left pane represents the fields of the monitored Tiers stored in the Performance Management Database. Each data field is mapped to an expression in the database, for example, Timestamp is mapped to a time of an event, and Program is mapped to a program name. From the Data Tree, select the required field and click the arrow near the Report Fields area. The field is added to the Report Fields area. Repeat this step as for every field you want to view.
...
- If you want to remove a field from the report, select the field and then click Remove.
...
- Click the up and down arrows to modify the order in which the fields will be displayed in the resulting SQL SELECT statement, and in the resulting Microsoft Excel spreadsheet.
...
- Use the Sort option to determine whether the rows will be displayed in ascending (A) or descending (D) order in the resulting Microsoft Excel spreadsheet. To sort, first select the box for the selected field. A check mark appears to show that this field was selected for sorting. Next click to set the order of the sort: ascending (A) or descending (D).
Setting filtering conditions
You can set filtering conditions to filter the data displayed in your customized report, through the Filter Table
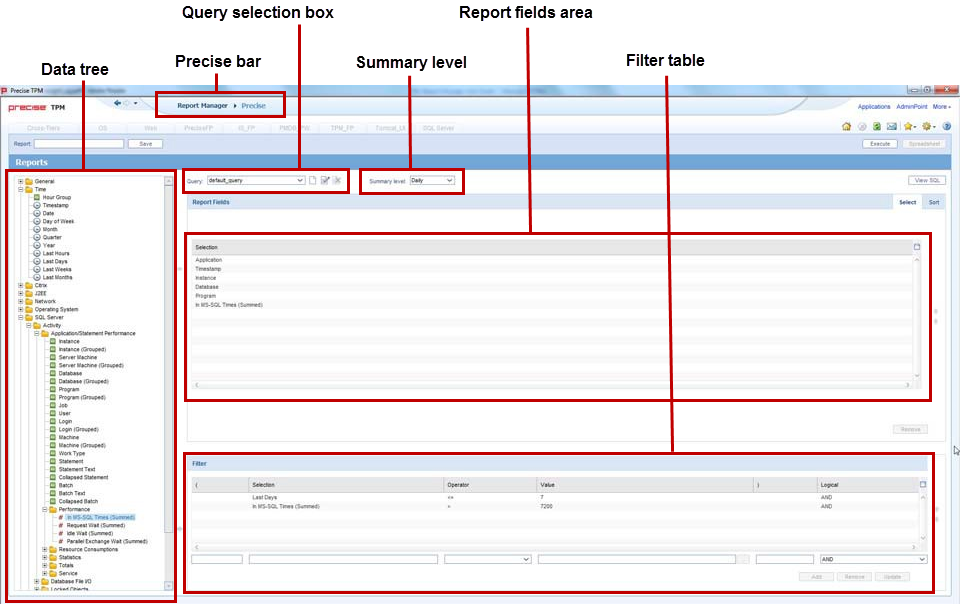
The following figure shows how to set the filter conditions in your customized report.
Figure 3-1 Customized 1 Customized report data selection page - filtering conditions example
Data tree
Precise bar
Summary level
Query selection box Report fields area
Filter table
To set filtering conditions
...
To set filtering conditions
- From the Data Tree, select the field for which you want to create the condition, and then click (arrow) of the Filter Table. The selected field appears in the Field Selection box.
...
- From the Operator box, select the required operator, such as Like, =, <, and In.
...
- In the Value box, do one of the following:
...
- Type a value by which the data of the field is filtered.
...
- Click the List icon and choose a data field from the List of Values dialog box.
...
- To remove a condition from the Selected Instances table, select it and then click Remove.
...
- To update a condition, select it from the Selected Instances Table, modify the condition parameters, and then click Update.
...
- To modify the order of the conditions, select the required condition from the Selected Instances Table and click UpArrow or DownArrow (located to the right of the Selected Instances Table).
Viewing and editing the SQL SELECT statement of a query
Report Manager creates an SQL SELECT statement for each query that you define. Actually, this statement is used to retrieve the required data from the Performance Management Database.
...
If you want to return to the original SQL statement to be able to update the query through the Customized Report Data Selection page, click Revert in the View SQL dialog box.
To view and edit the SQL SELECT statement of a query1. After
- After completing the query definition in the Customized Report Data Selection page, click View SQL (located at the top right). The View SQL dialog box is displayed.
...
- To edit the SQL SELECT statement, click Edit and then modify the statement in the query text area.
...
- Click OK.
Running and designing a customized report
Report Manager generates the customized report using the query that you define in the Customized Report Data Selection page, and then displays the report in a Microsoft Excel file. The Microsoft Excel file consists of the following worksheets:
- One worksheet for each query that you have defined. These worksheets are protected so that no manual changes are allowed (Report Manager overrides these worksheets for each execution). The name of each worksheet is composed of the query name appended to the prefix FS-.
- A worksheet named report-design, in which you can design the customized report. That is, creating charts, tables or any additional elements that describe the data included in the protected worksheets. In addition, you can create new worksheets with additional elements. Report Manager does not override these worksheets in each execution.
...
| Info |
|---|
Verify that you do not name the new worksheet with the FS- prefix, because then it will disappear the next time that the report is run or edited. |
To run and design a customized report1. From
- From the Customized Report Data Selection page, click Execute. Report Manager generates and then displays the report in a Microsoft Excel file. There are two worksheets in the Microsoft Excel file: the report design worksheet (labeled "report_design") and the protected worksheet (labeled by query name).
...
- In the Microsoft Excel file, select the report-design worksheet and design the customized report. When you complete the design, save the Microsoft Excel file.
...
- In Report Manager, in the Customized Report Data Selection page, type a name for your customized report in the Report name box, and then click Save (located at the top left).
Editing an existing customized report
Report Manager enables you to modify the queries of existing customized reports and to redesign the report-design worksheet of the Microsoft Excel file.
To edit an existing customized report1. From
- From the Reports Table, select the customized report and then click Edit. The Customized Report Data Selection page opens including all the queries defined for the report.
...
- To redesign the customized report, click Spreadsheet (located at the top right). Report Manager opens the Microsoft Excel file of the last executed customized report.
...
- To modify the selected data, change the existing queries or add new ones as required, and then click Execute.
Report Manager executes the queries and then displays the report in a Microsoft Excel file.
...
- In the Microsoft Excel file, select the report-design worksheet and redesign the customized report. When you complete the design, save the Microsoft Excel file.
...
- In Report Manager, in the Customized Report Data Selection page, click Save. Report Manager overrides the existing report.
| Anchor | ||||
|---|---|---|---|---|
|
...