For WhereScape defined profiling...
- Select Manage profiling methods from the Tools menu:
- The WhereScape profile contains the SQL queries and rules for profiling a specific database and database version.

- There are a number of methods; and each method contains queries and metrics.
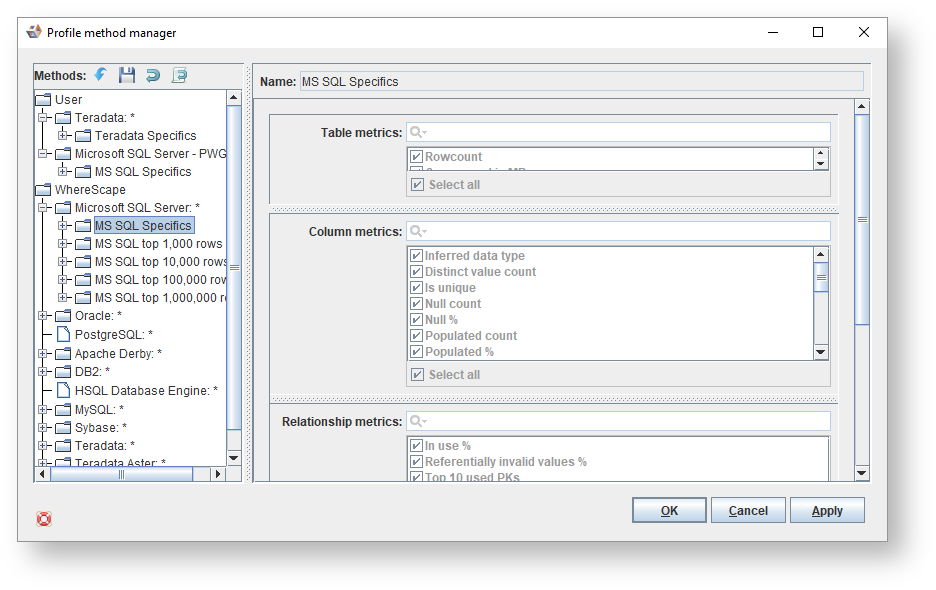
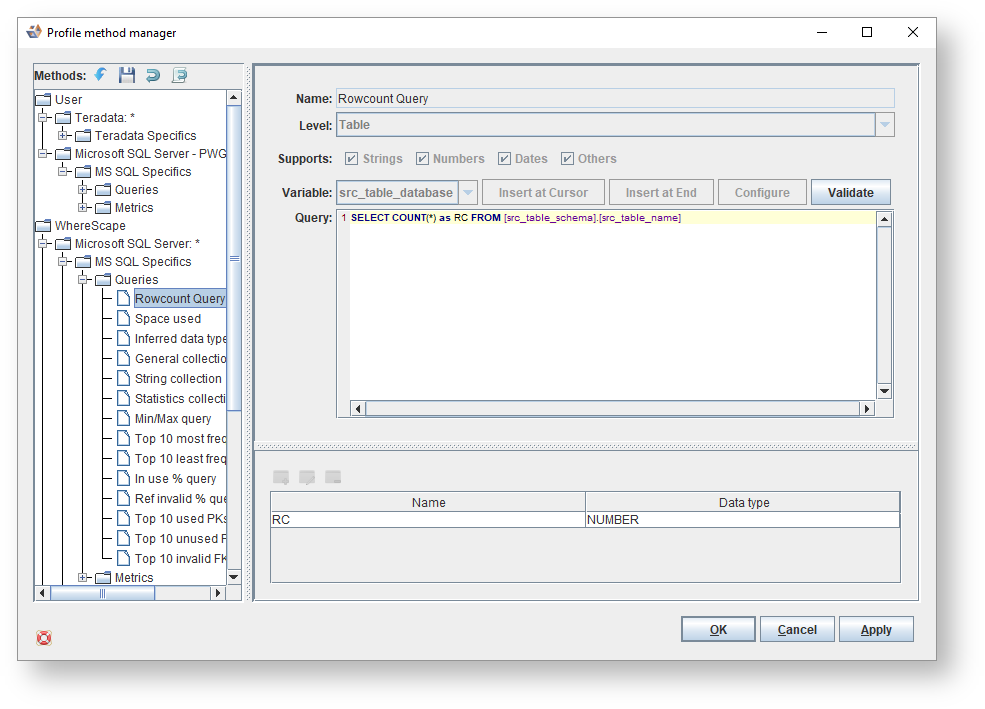
- Looking at the Profiling Method for MS SQL Specifics for example; you can view the profiling on Queries for:
- Rowcount Query
- Space used
- Inferred data type query
- General collection
- String collection
- Statistics collection
- Min/Max query
- Top 10 most frequent values query
- Top 10 least frequent values query
- In use % query
- Ref invalid % query
- Top 10 used PKs
- Top 10 unusued PKs
- Top 10 invalid FKs
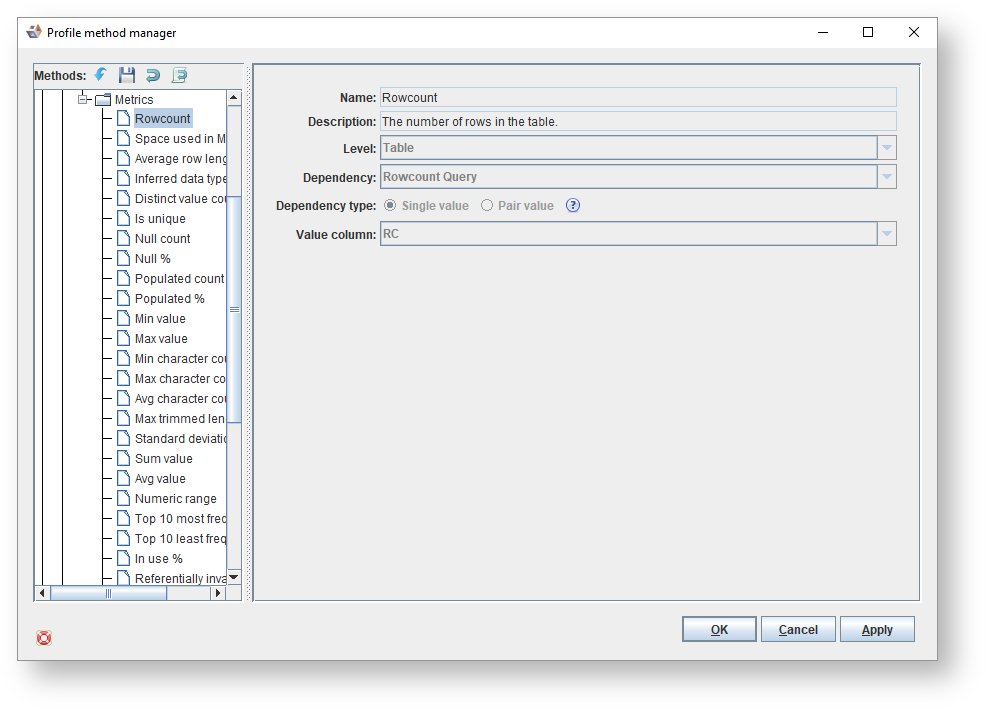
- You can also view the profiling on Metrics for:
- Rowcount
- Space used in MB
- Average row length
- Inferred data type
- Distinct value count
- Is unique
- Null count
- Null %
- Populated count
- Populated %
- Min value
- Max value
- Min character count
- Max character count
- Avg character count
- Max trimmed length
- Standard deviation
- Sum value
- Avg value
- Numeric range
- Top 10 most frequent values
- Top 10 least frequent values
- In use %
- Referentially invalid values %
- Top 10 used PKs
- Top 10 unused PKs
- Top 10 invalid PKs
- Looking at the Profiling Method for MS SQL Specifics for example; you can view the profiling on Queries for:
Note
To customize profiling methods, the best approach is to clone the default WhereScape defined profiling method to create a User defined profiling method, which can then be modified as required.