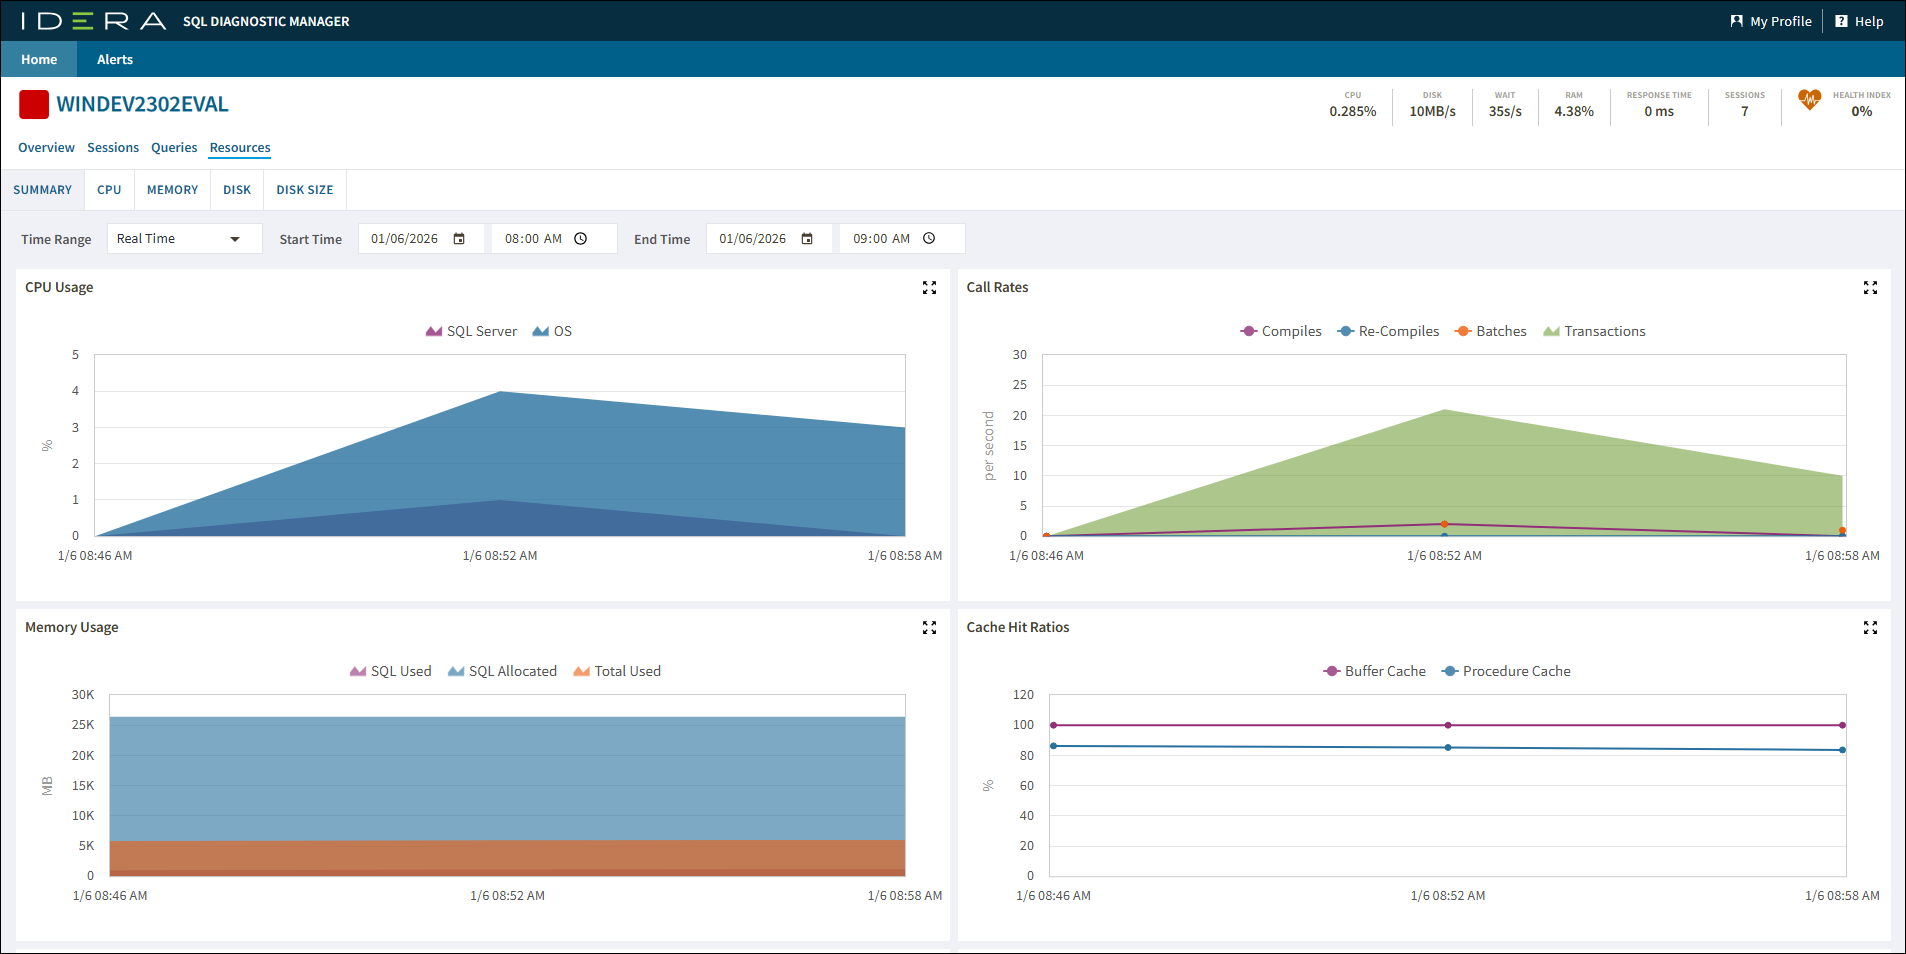
The Resources tab of the single instance dashboard allows you to monitor the system resources on the computer hosting the SQL Server instance as well as what is used by SQL Server. The Resources tab contains the following tabs:

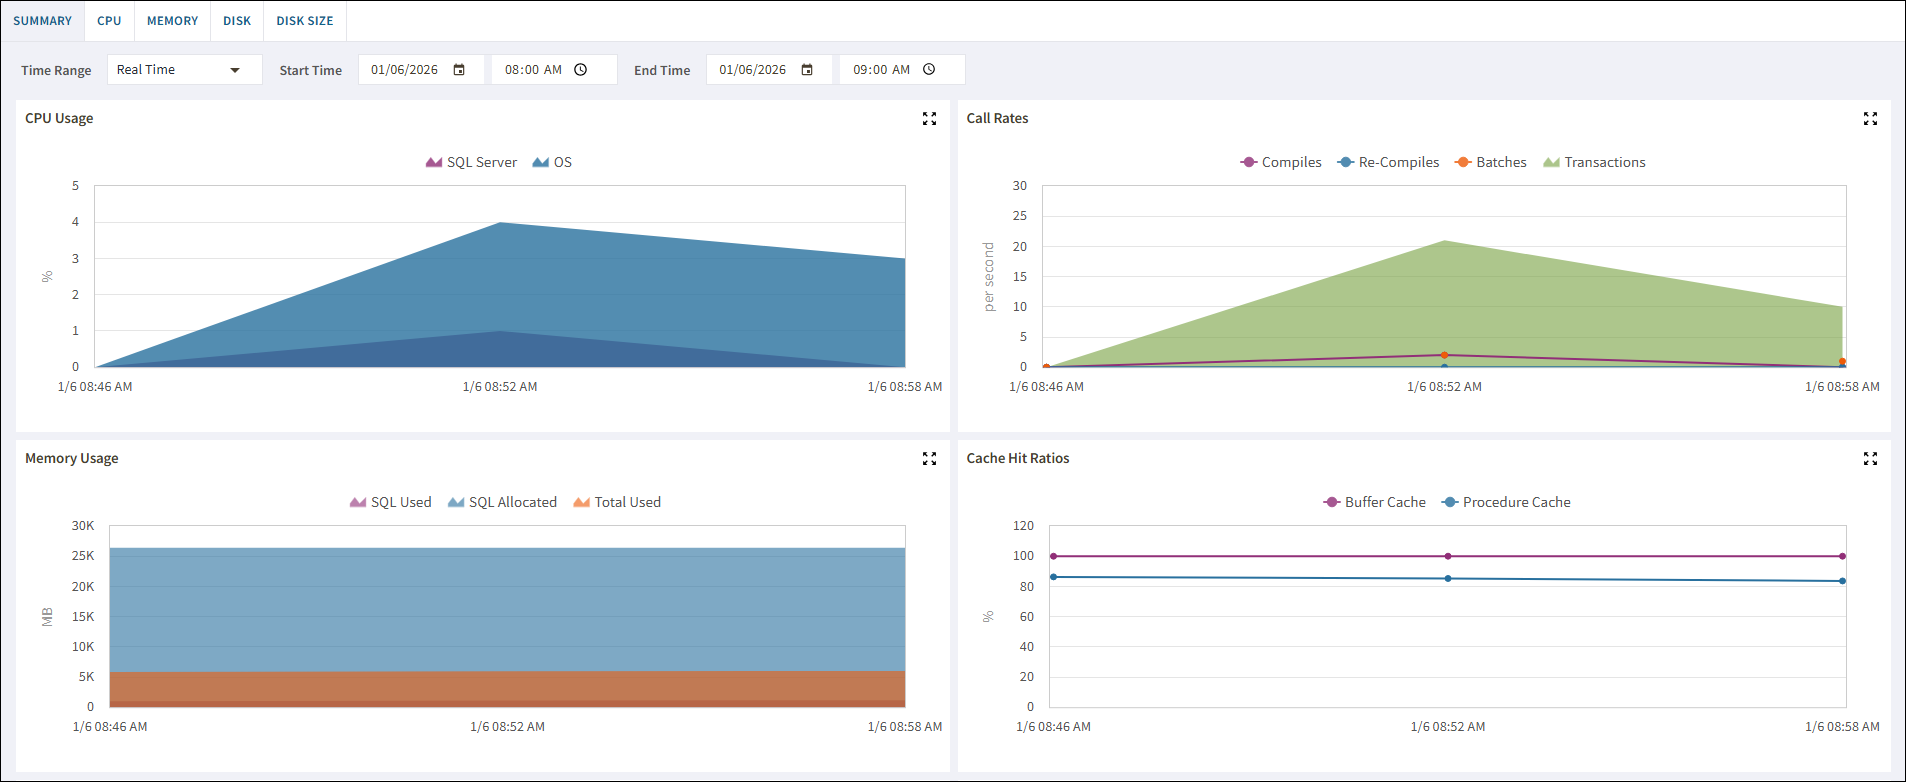
The Summary tab displays real-time charts that allow you to quickly view key diagnostic statistics for monitoring the resources for the selected SQL Server instance and computer on which it resides. For more information about using this view and fields, see the help topic for the desktop version at: Get the resource performance summary.
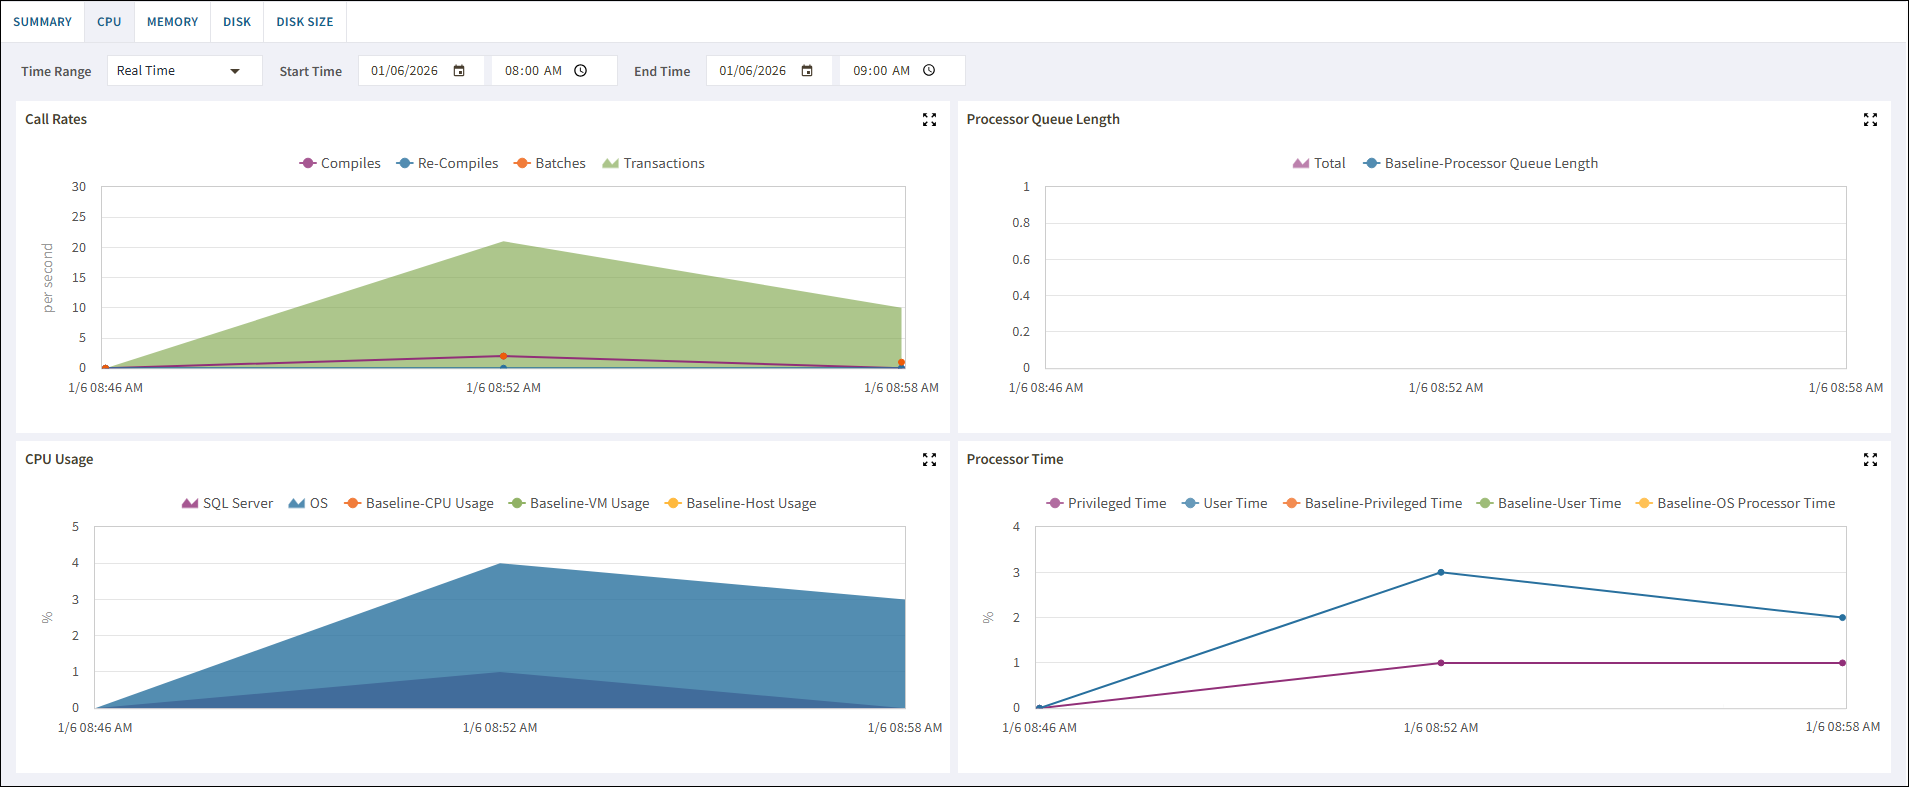
The CPU tab displays key CPU statistics that are updated according to your refresh interval. For more information about using this view and fields, see the help topic for the desktop version at: Get CPU performance details.
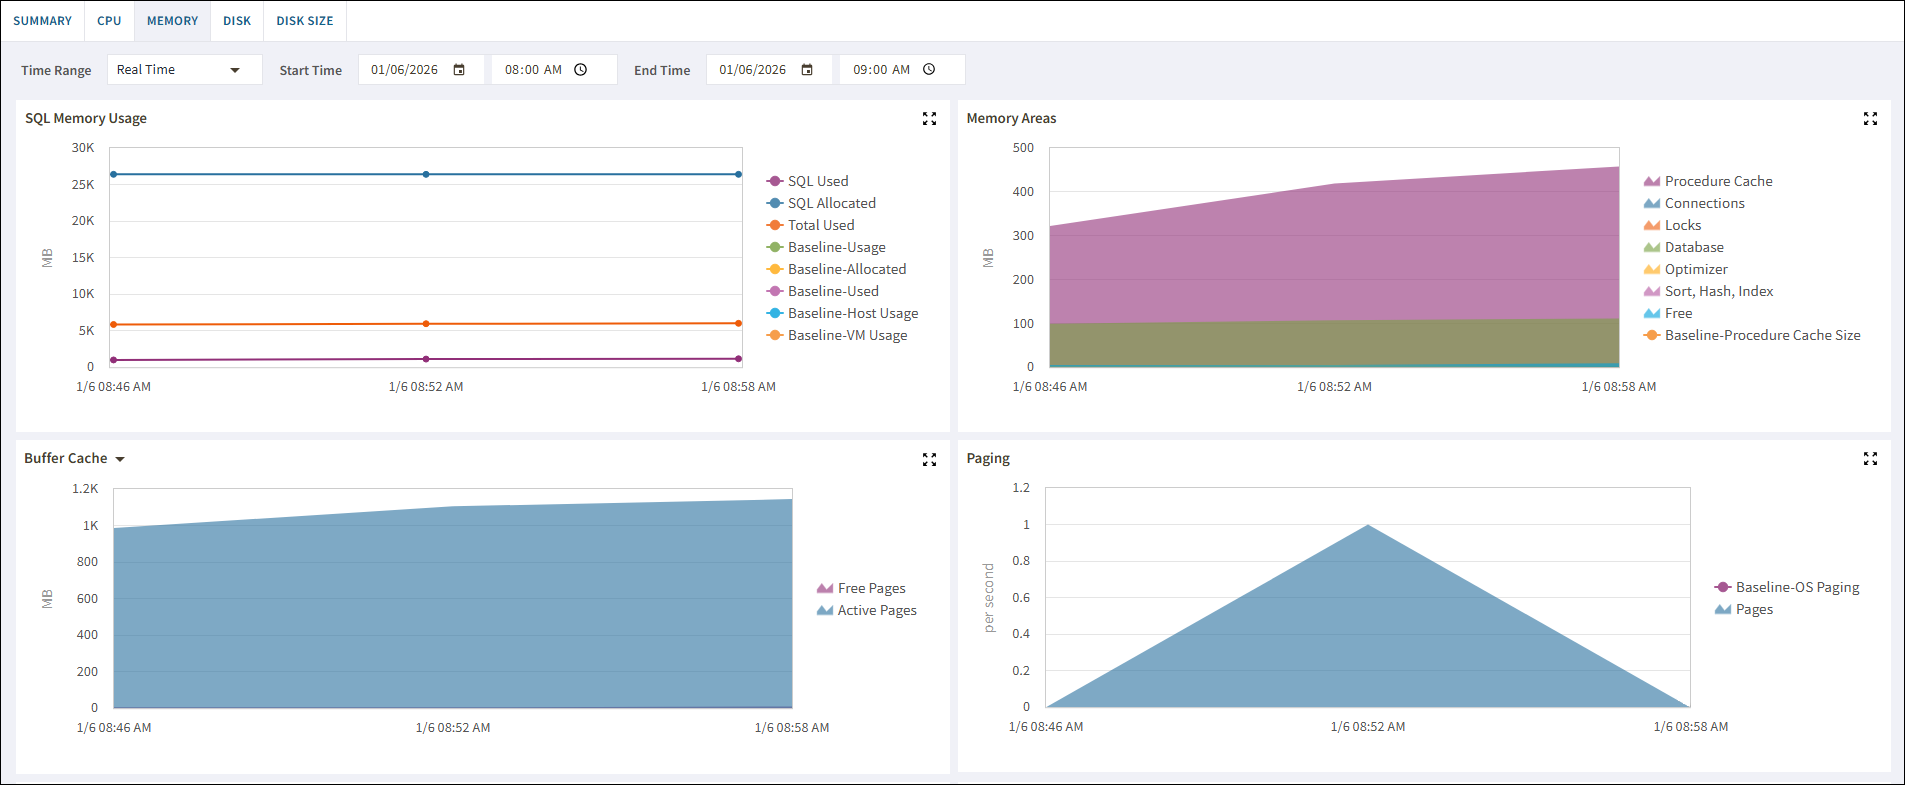
The Memory tab displays the dynamic memory currently in use by SQL Server as well as how that memory satisfies the requirements of SQL Server components. For more information about using this view and fields, see the help topic for the desktop version at: Get memory performance details.
The Disk tab allows you to view key statistics on the way your disks are used on the computer hosting your SQL Server instance. For more information about this view and fields, see the help topic for the desktop version at: Get disk performance details.
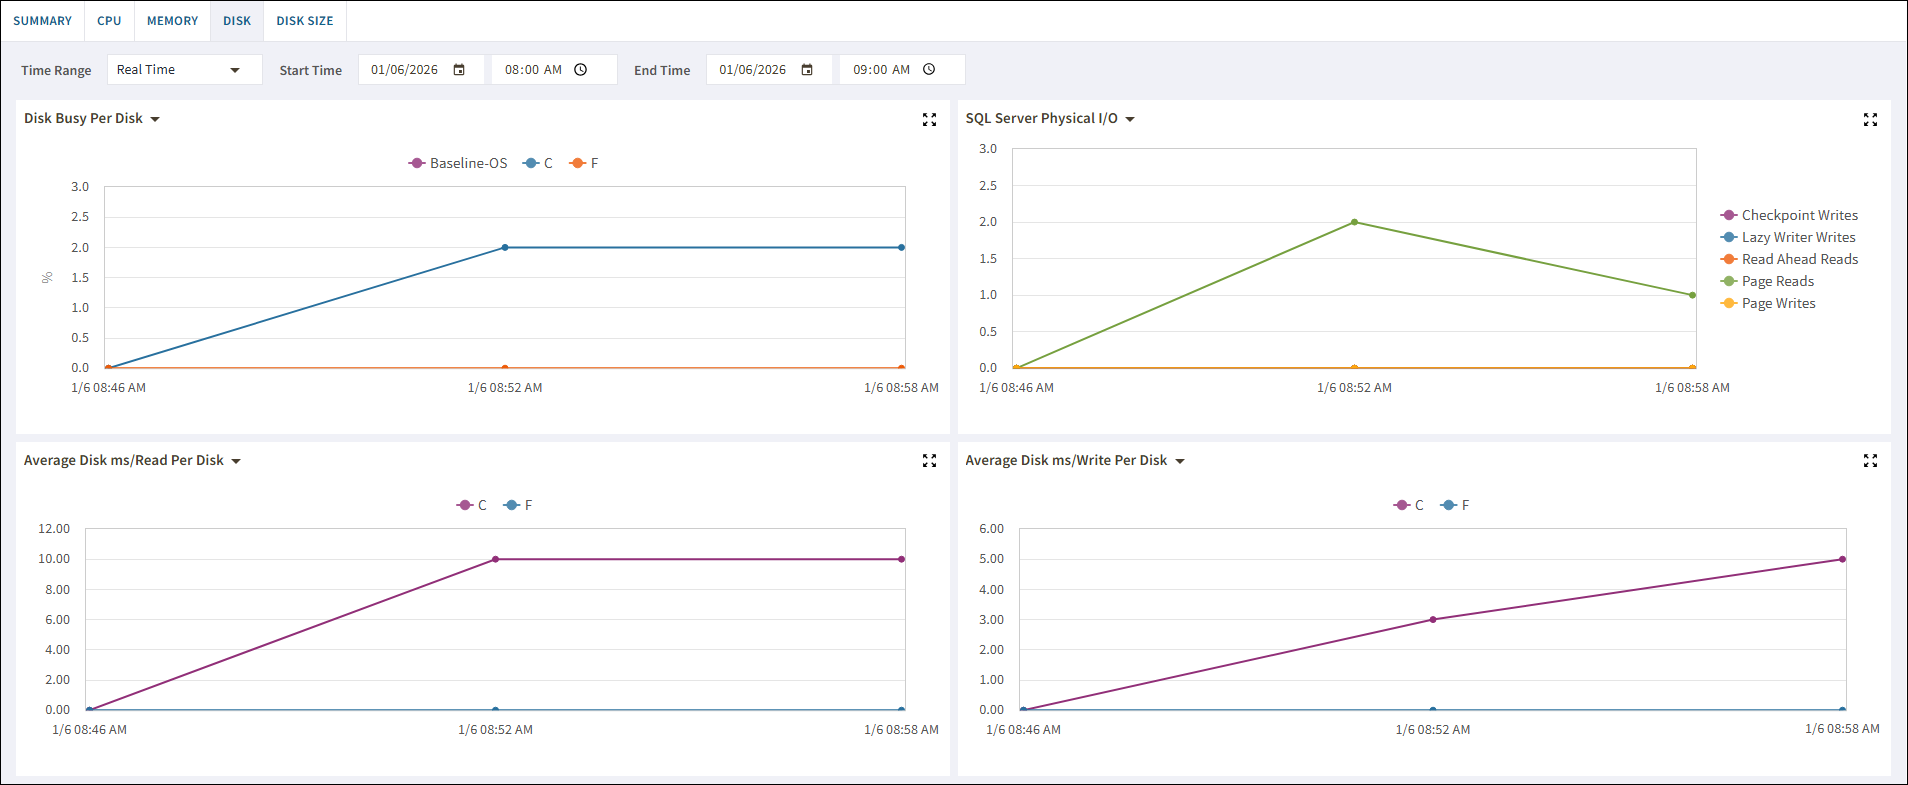
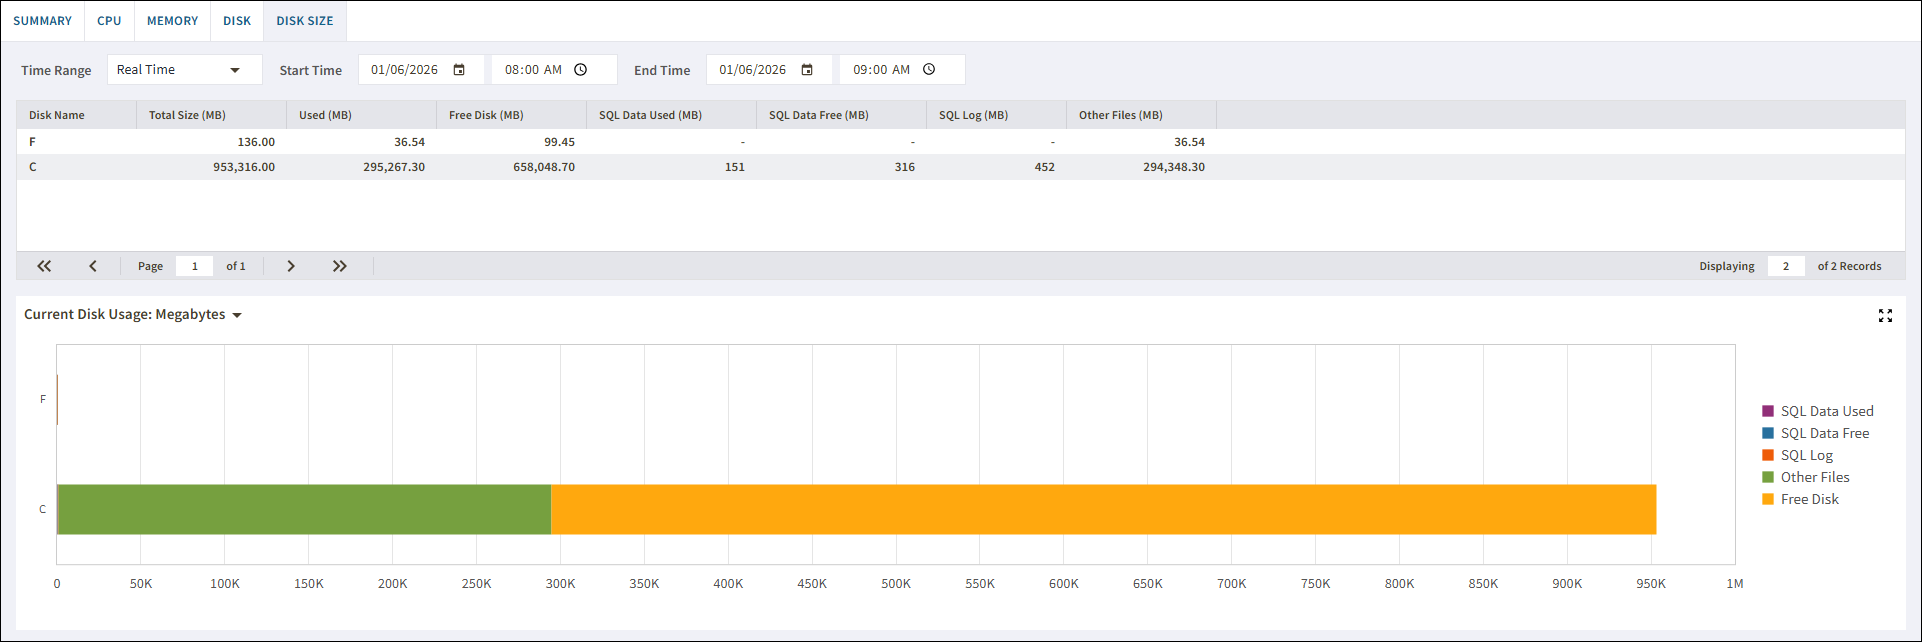
The Disk Size tab allows you to view key statistics on the way your disks are used on the computer hosting your SQL Server instance. For more information about this view and fields, see the help topic for the desktop version at: Get disk size details.
|