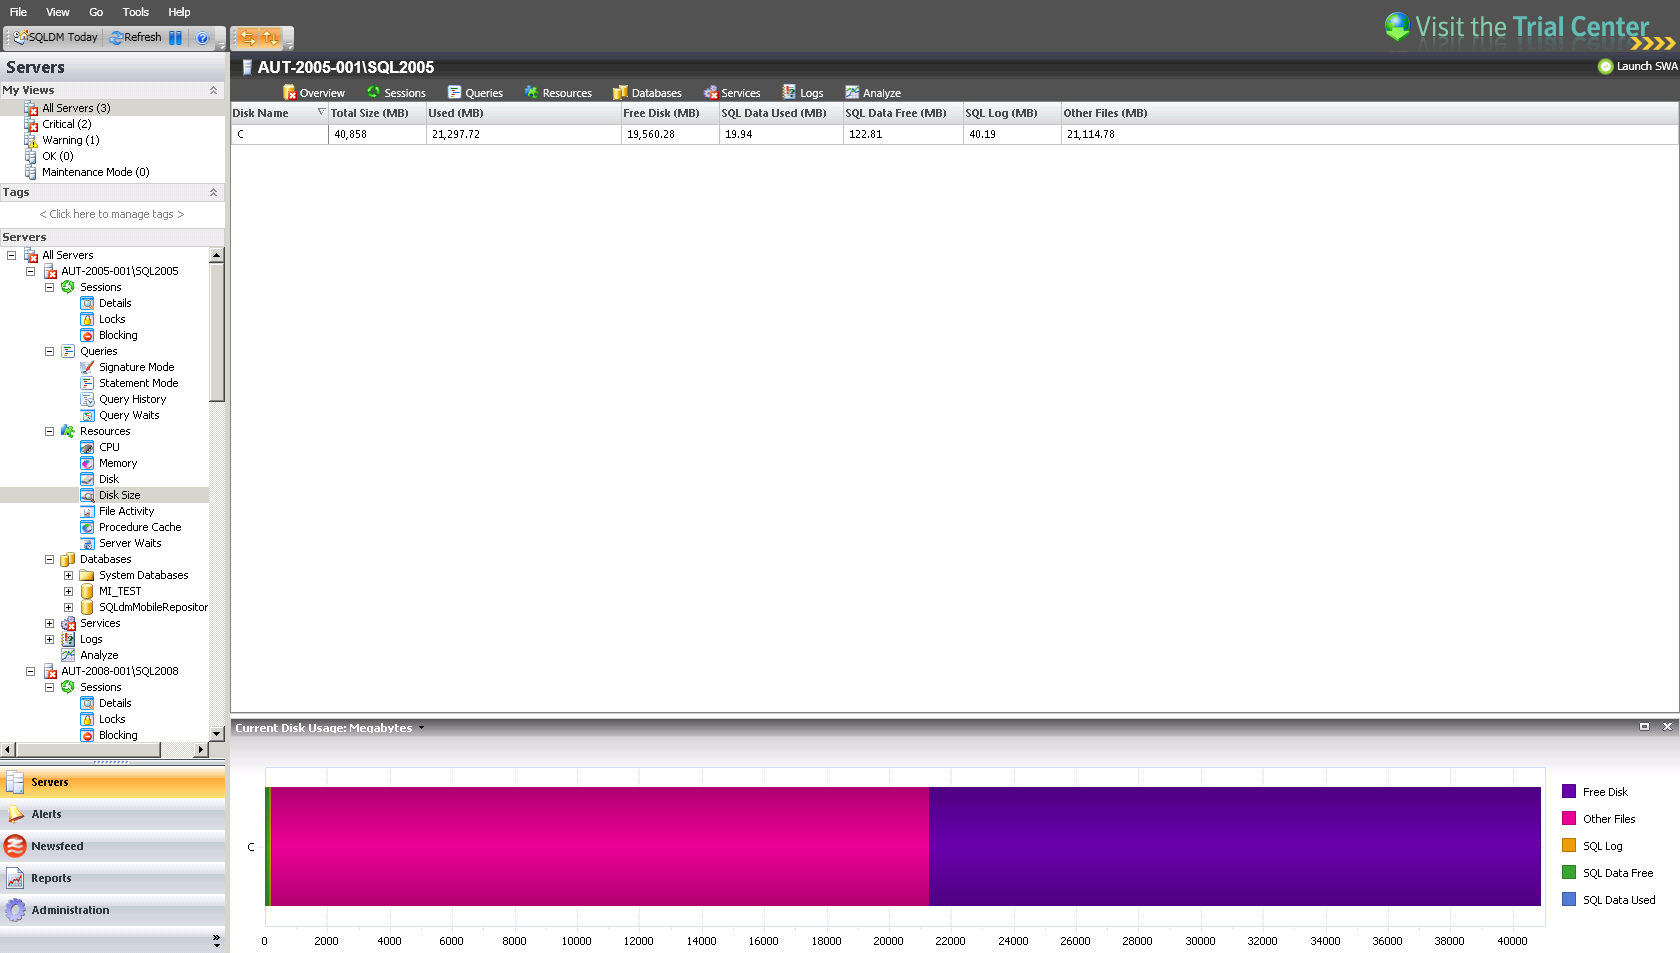
The Disk Size tab allows you to view key statistics on the way your disks are used on the computer hosting your SQL Server instance. This allows you to analyze your disk performance for any performance bottlenecks that may be occurring.
You must have OS metrics enabled to show the information in the charts on the Disks tab. |
You can open the Disk Size view by selecting the appropriate SQL Server instance, and then clicking Disk Size in the Views group of the Resources tab. Click image to view full size.

Disk Size tab details include:
The Disk size tab includes a chart that displays the current disk usage. The drop-down list allows you to choose to view the data in megabytes or percentages.
SQL Diagnostic Manager charts provide data whether collected real-time or as part of a scheduled collection event. For additional information about how SQL Diagnostic Manager displays your chart data, see Charts.
You can print, export to Excel, or save the Current Disk Usage chart image. |
SQL Diagnostic Manager identifies and resolves SQL Server performance problems before they happen. Learn more > >
|