The Query Details view provides various views with detailed information on each query. The Query Details view is comprised of the following tabs:
The Plan Diagram and Plan XML views are only available for instances running SQL Server 2008+. |
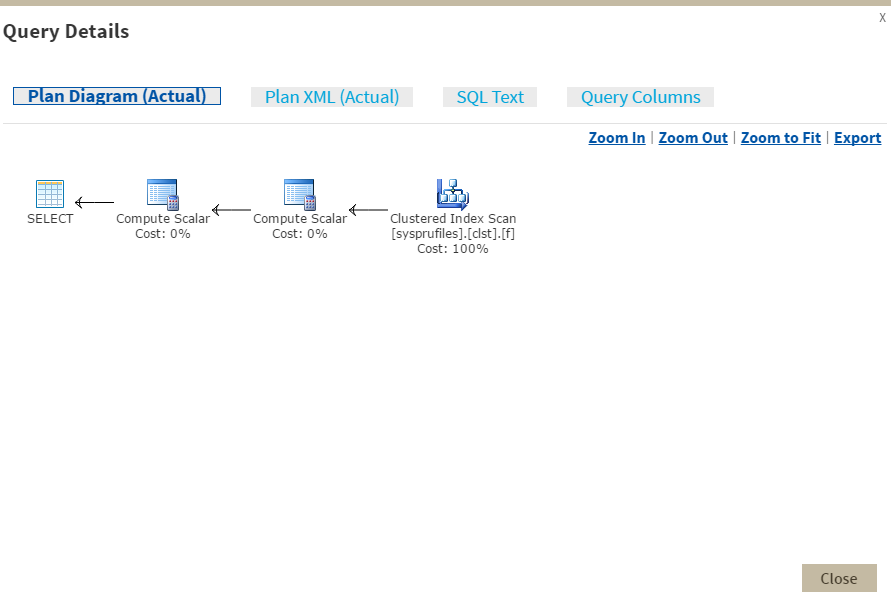
The Plan Diagram is a visual representation of the query execution plan (actual or estimated) available in XML format in SQL Server. The Plan Diagram displays a view of the tree of operations that make up a query. This tree shows individual operation nodes, pertaining graphical execution plan icon, along with basic information such as operator name and operation percentage of total cost. Click image to view full size.

In the Plan Diagram view you can perform the following actions:
The top three operators based on the percentage of total cost in a Plan Diagram are highlighted in yellow. |
SQL Diagnostic Manager displays information on whether the plan displayed is an estimated query plan or an actual one. |
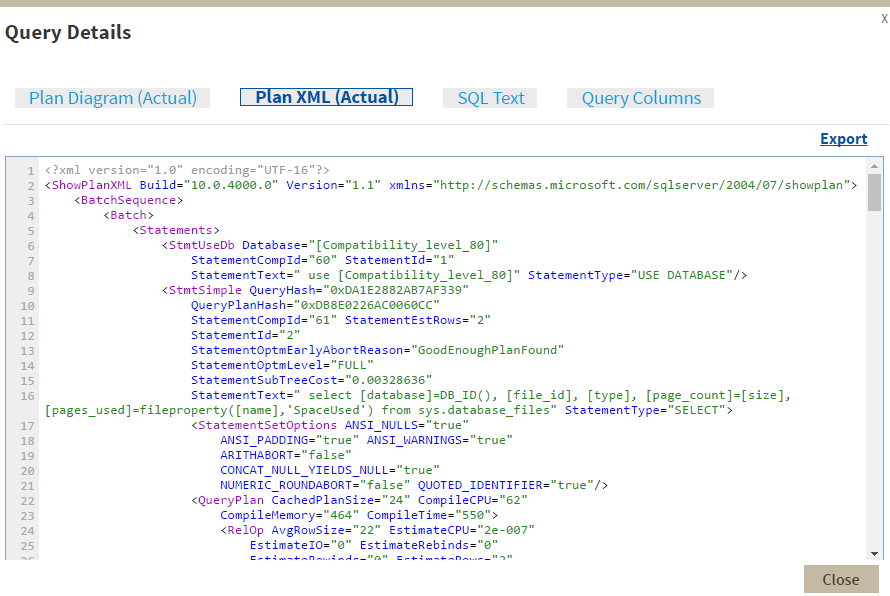
The Plan XML tab of the Query Details window displays the actual XML of the query execution plan. It has a syntax-highlighting (color-coded) XML viewer. Click image to view full size.

In the Plan XML view you can perform the following actions:
Save the file with . |
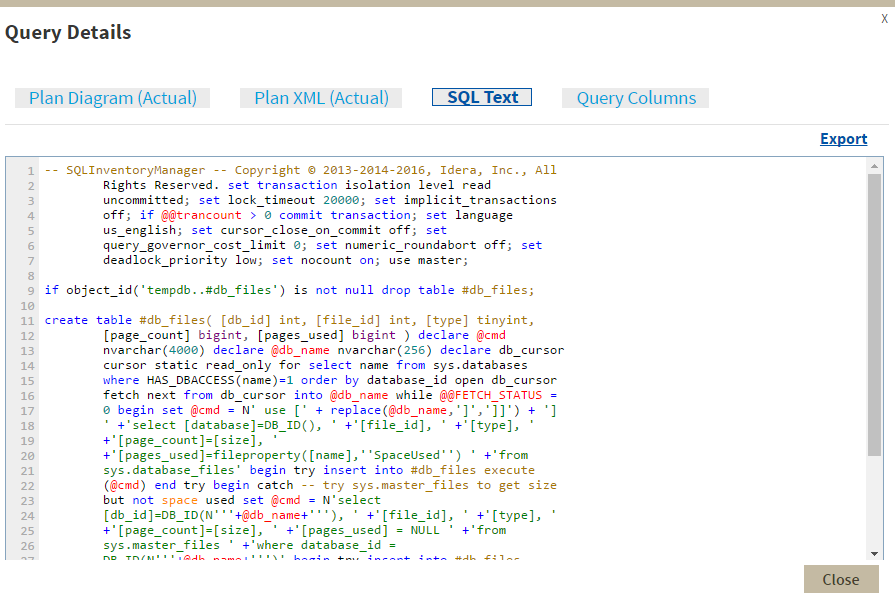
The SQL Text tab of the Query Details window shows the underlying SQL Text for the query execution plan.

In the SQL Text view you can perform the following actions:
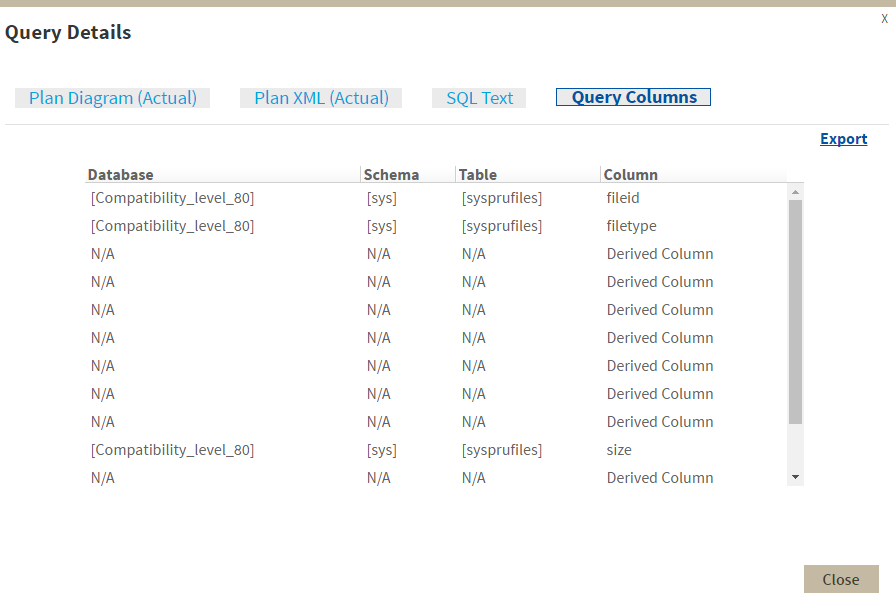
The Query Columns tab of the Query Details window shows all the referenced columns for the query execution plan.

In the Query Columns view you can perform the following actions:
SQL Diagnostic Manager identifies and resolves SQL Server performance problems before they happen. Learn more > >
|