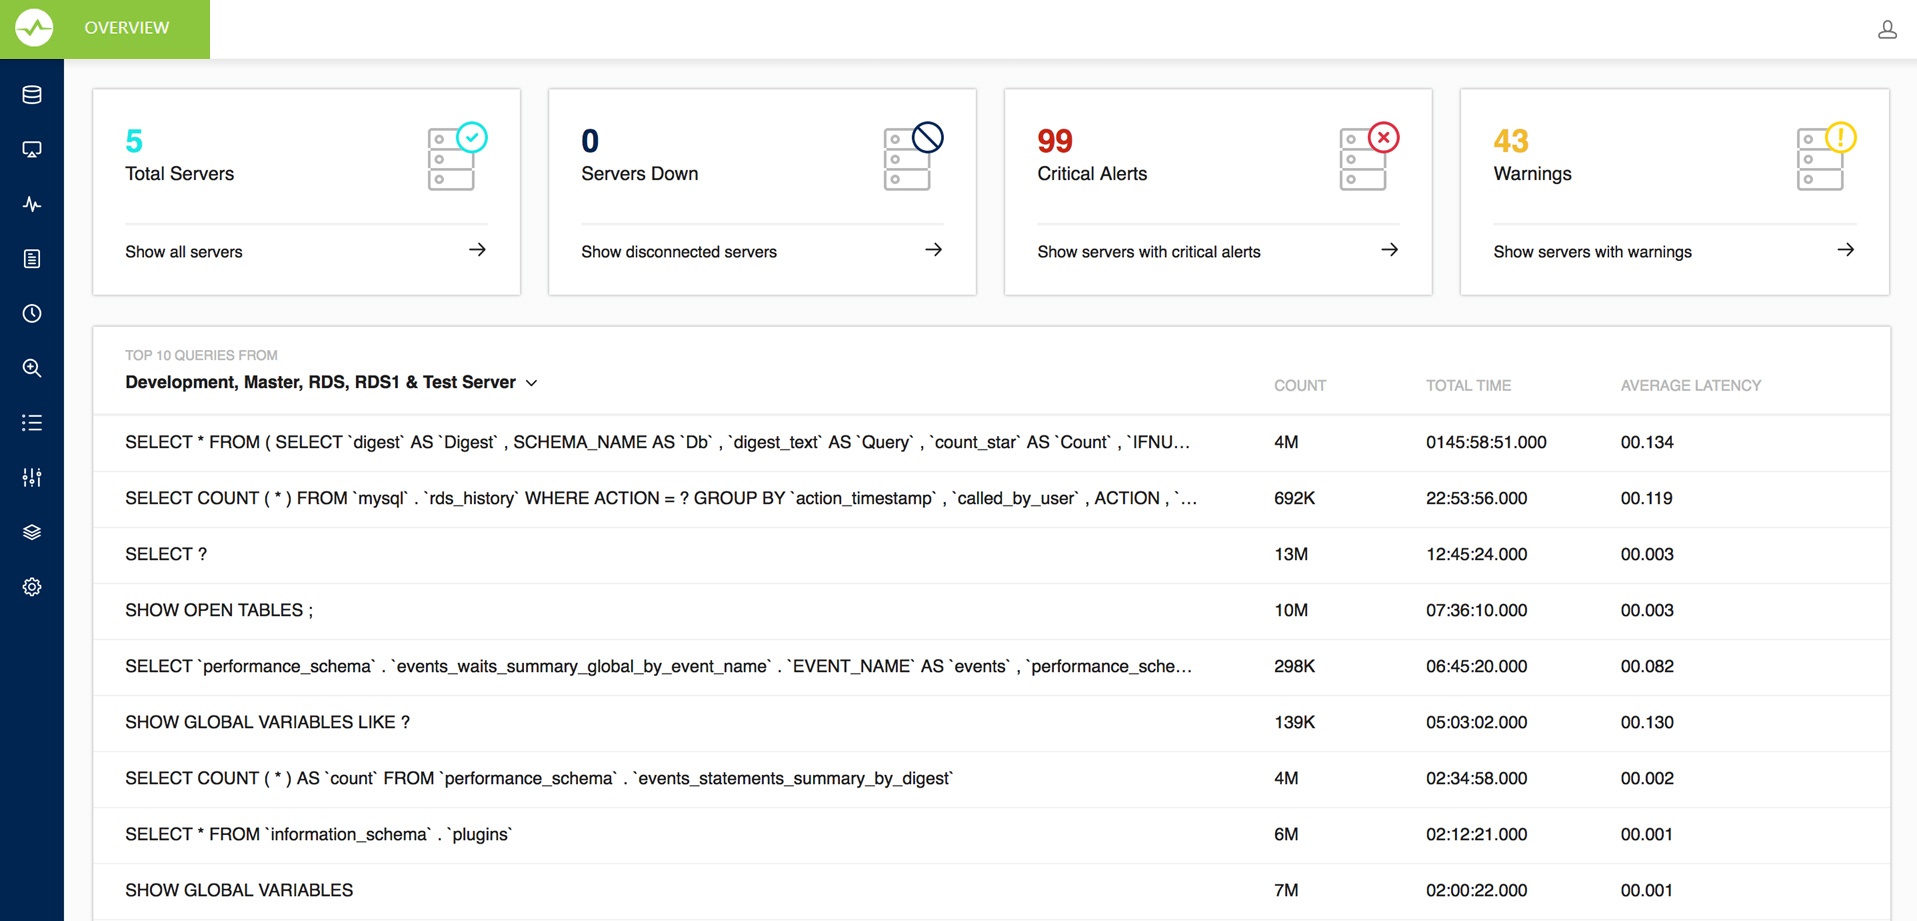
The Overview gives the top level picture of all the servers registered with SQL DM for MySQL. It gives the count of the total servers registered with SQL DM for MySQL, total number of disconnected servers, servers having critical alerts, and the servers having warnings. You can further drill down to Servers page with the corresponding categories from the Overview page.

Overview also gives you the Top 10 Queries across all the servers registered with SQL DM for MySQL based on total execution time and also lists the count and Average latency for each of the queries. The queries are basically filtered from the "sniffer.data" file of all the registered servers. You can click the queries to get the query details which also gives you the list of server names on which the particular query was executed. Clicking the server names to open Sniffer for the selected server, with the time-range selected as the first seen and the last seen of the query.
|