Profiling enables you to store parameters related to specific profiling sessions, in a profile configuration for stored routines. Multiple configurations can be created for each data source in your enterprise and saved with unique names that identify them in the application.
On all supported platforms, support for stored routines includes functions and procedures. On Oracle, stored routine support also includes package functions and package procedures. |
To create a profile configuration
- Right-click the data source you want to build a configuration for and select Profile As from the menu, then choose Profile Configurations.
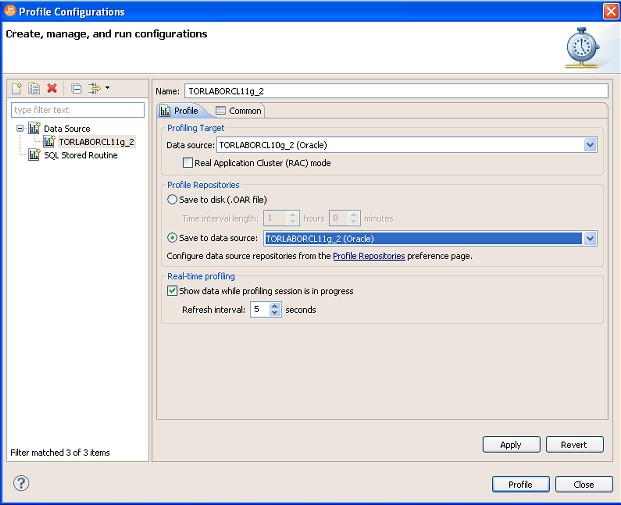
The Profile Configurations dialog appears.

- Select the name of the data source and modify the parameters on the Profile tab, as needed.
- In the Name field, provide a name for the launch configuration. You should select a name that will make the launch configuration unique and easily identified once it is saved in the application.
In the Profiling Target area, click Real Application Cluster (RAC) mode if the target database is an Oracle RAC. This enables you to profile the entire cluster in one profiling session. (In general, profiling a RAC entails querying the GV$ views.)
When profiling a RAC, you can also filter the profiling details to show only the details for a selected instance. At the top of the Profiling view, click the Instances list and choose the instance you want to examine. |
- In the Profiling Repository area, choose to save the profile session to disk or if you are profiling an Oracle data source then you can choose to save the profile session to a data source registered as a Profiling Repository.
If you choose to save the session to disk, in the Time interval length area specify the length of the profiling session. When you try to close the Profile Session, you will be prompted to save the file and can then name the file as desired.
A .oar file saved to disk opens very quickly from File > Open dialog and has a limit of just under 1000 hours of profiling data. Profiling to a data source directly allows the system to capture more data for a longer period of time, until you decide to stop the profiling session. The profiling session is automatically saved to the Profiling Repository where other SQL Query Tuner users can also view the session for their own analysis. - Click Apply. The launch configuration is stored in the application.
- Once a launch configuration is defined, you can execute it in profiling. For more information, see Running a profiling session.
The following describes fields and options of the Profile tab that require further explanation.
- Name indicates the name of the profile configuration.
- Data source indicates the name of the data source to which the profile applies.
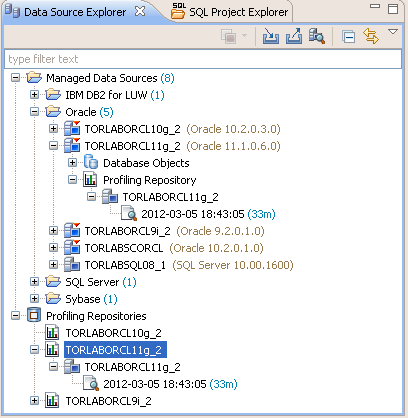
- Save to disk/Save to data source gives you the option to save your profiling session to a .oar file which you can access from within SQL Query Tuner or you can save the profiling session to a data source of your choice if you are using an Oracle data source. SQL Query Tuner will create a Profiling Repository, similar to the following on the selected Oracle data source. The structure of the Profiling Repository is created from the name of the data source and the date and time of each specific profiling session.

Saving your profiling sessions to a live data source enables you to better organize your profile session data for later review.
- Time Interval Length indicates how many hours of the session to save to disk. Since the profile session continues until you manually stop it the session length may exceed the time interval length. For example, the time interval length is set to four hours but the profiling session continues for 10 hours. In this case only the last four hours of data is retained. This parameter also indicates the total width of the time load graph. The longer a profile is, the larger the saved file will be. For heavily loaded databases, the time interval length value should not exceed eight hours.
- The Show Data While Profile Session is in Progress check box enables "real time" profiling, which refreshes the data of the session as profiling runs. The Refresh Interval specifies how often in seconds profiling updates this data.
Profiling can run sessions based on ad hoc parameters you designate before executing the profiling process. However, by building profile launch profiles, it is a much more efficient method of managing standard, frequent, or common profiling sessions. |

