SQL DM for MySQL provides a series of charts that address general monitoring needs for MySQL systems. It also ships with a general purpose dashboard for monitoring database performance. Also, you can create your own custom dashboards and charts.
Custom Dashboards
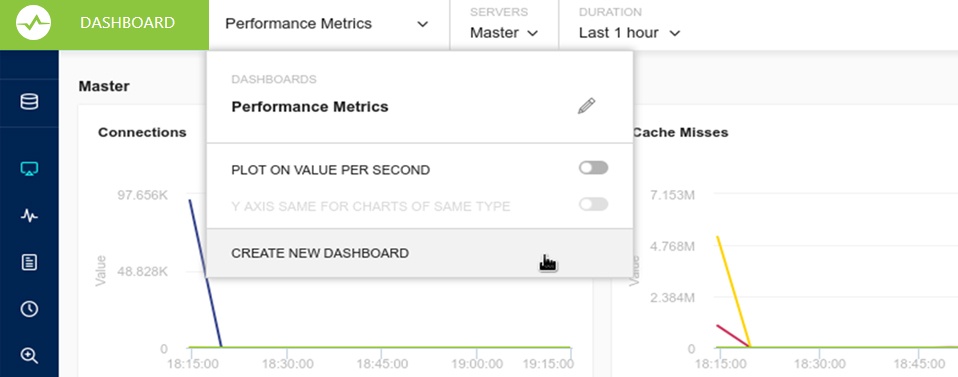
To create a custom dashboard, open the dashboard selection context menu. Then click Create New Dashboard. It opens an overlay to configure the dashboard, select the charts you want to display. In the event that you would like to modify an existing dashboard, click the edit icon beside it in the same menu.
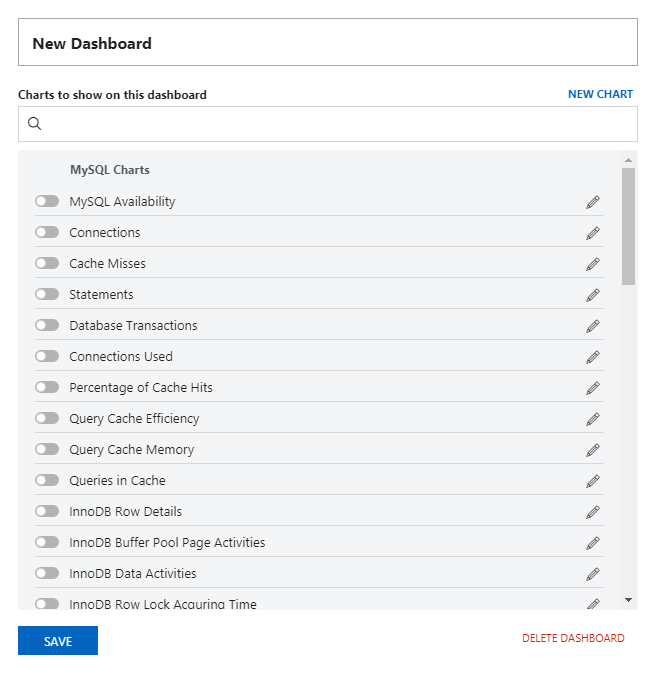
From the overlay, enter a logical name for the dashboard in the text field, then select the charts that you want to be added to the dashboard. In the event that you need a chart for something that is not available, you can create a new chart. Click Save to make the new dashboard available in SQL DM for MySQL.
Custom Charts
In addition to the many charts that SQL DM for MySQL provides by default, you can create custom charts to suit your own particular needs. To create a chart, create a new dashboard or edit an existing one, click the New Chart link in the overlay.
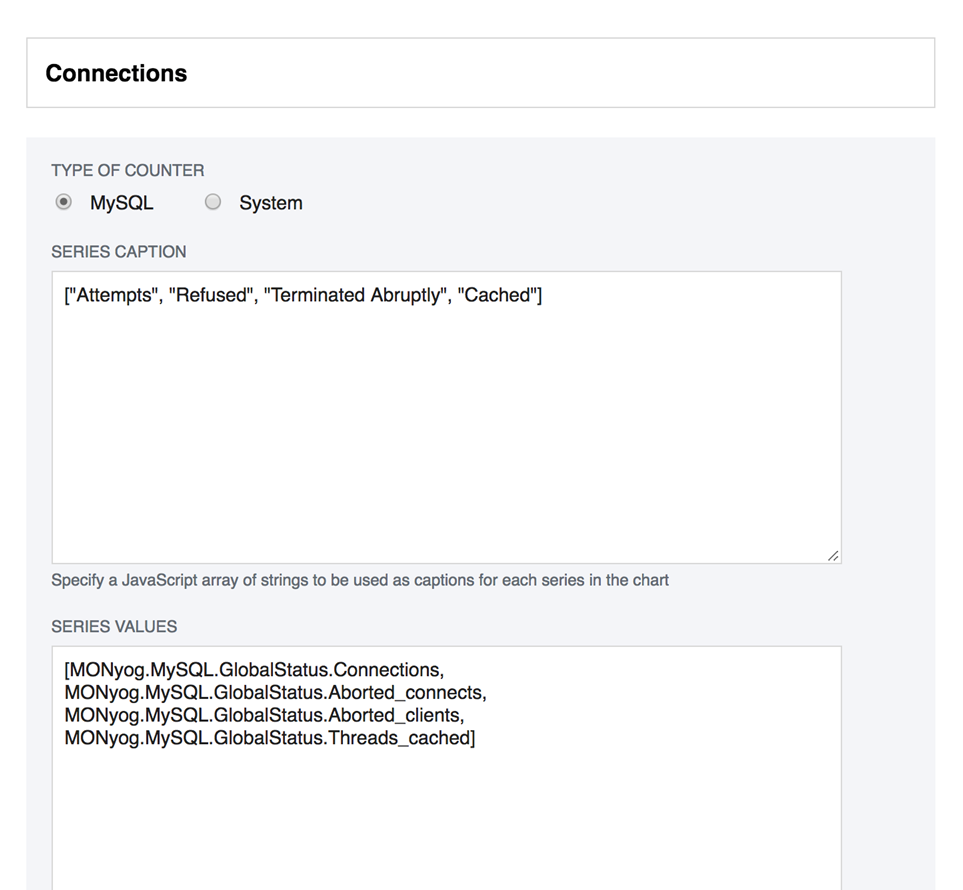
When clicking New Chart, the second overlay opens to configure the new chart.
Charts are of the MySQL or System type. MySQL charts get their data from the MySQL client interface. System charts get their data from the operating system, (through SSH, for instance). For each chart you can define a Series Caption, indicating the usual one to four values shown on the chart and series values to specify how to generate those values. Both are written as JavaScript expressions.
Once your new chart is ready, click Save. SQL DM for MySQL adds the chart to those available on the configuration overlay, where you can enable it for any dashboard.


