The term Trend Analysis refers to the concept of collecting information and attempting to spot a pattern, or trend, in the information. In some fields of study, the term Trend Analysis has more formally-defined meanings. Today, trend analysis often refers to the science of studying changes in social patterns, including fashion, technology, and the consumer behavior.
Analyzing history reports give you the means of tracking trends and identifying problem areas in your network. You can use this information to find recurring problems, which helps you prevent future problems. This data can also help you plan maintenance schedules and equipment replacement.
SQL DM for MySQL concerns itself with answering the following question:
- Was your MySQL down in the last one month?
- When did your MySQL traffic peak in the last few days?
And these are the few instances where we can find the answers for the following questions:
- When replication slave went down?
- Whether their was a hacking attempt?
- Which counters do you want to analyze?
- What time period do you want to analyze?
Answering the question thus becomes a matter of comparing different results and of analyzing their differences.
Graph Analysis
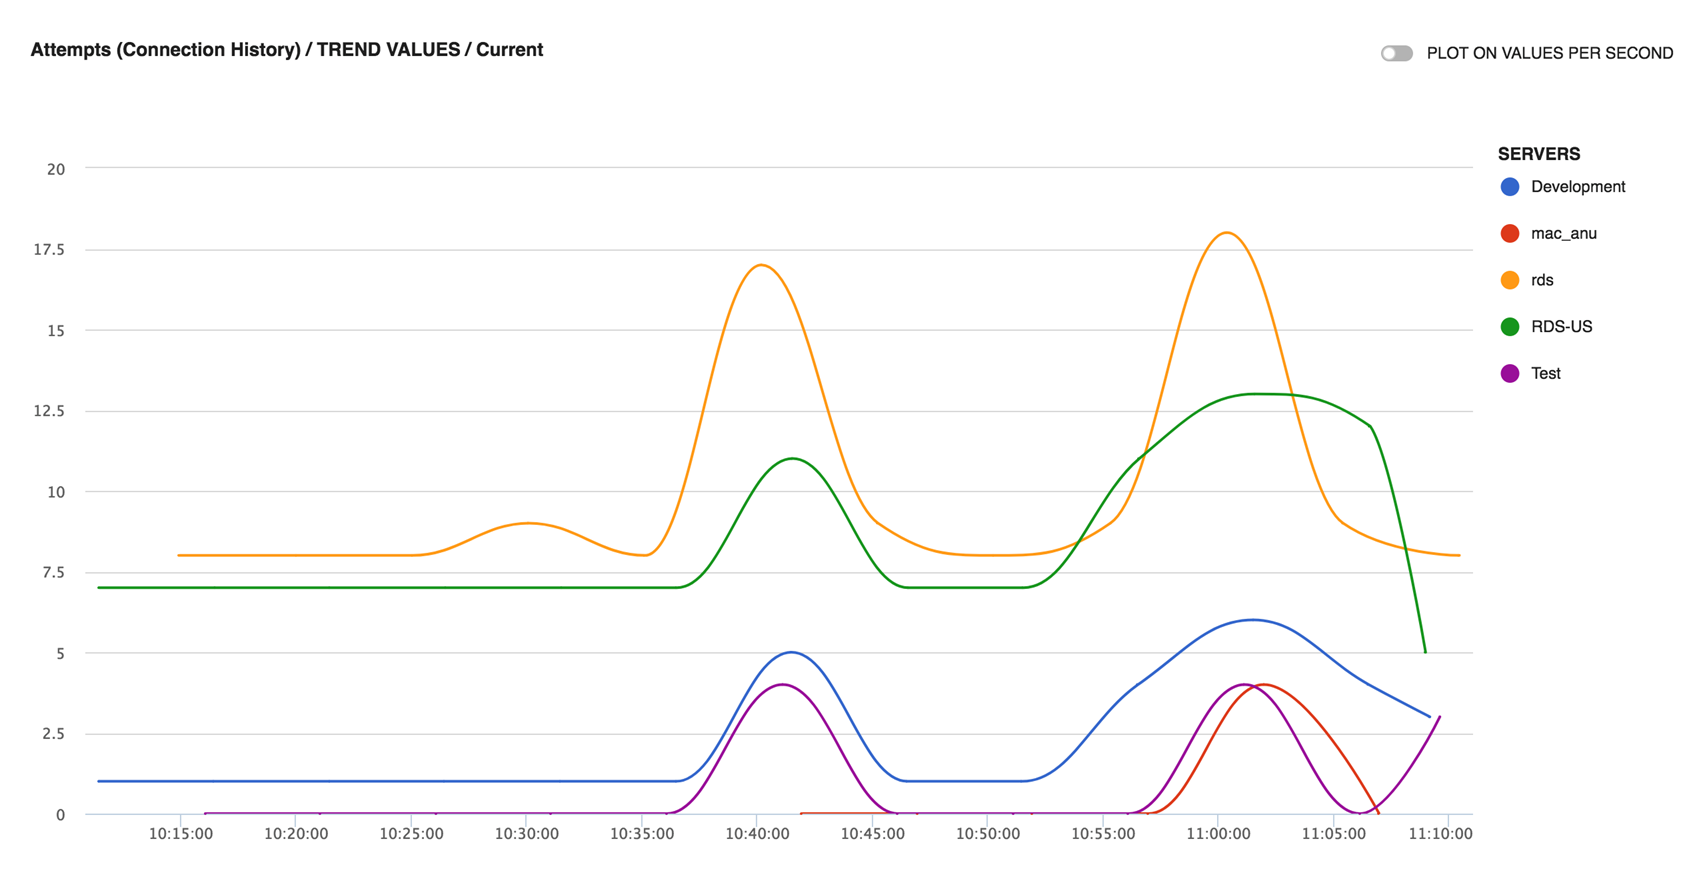
This feature is a further extension of the History/Trend analysis and lets you view the graphical representation for a monitor across different servers in one unified chart. You can either see the Current trend analysis (shows the graph for last 1 hour) or the Historical trend analysis for a selected time-frame.
Current Trend Graph
With the Current time-frame selected, the Trend graph icon is present just beside the monitor name. When clicking, it displays the trend graph of last 1 hour duration for the selected servers in the Monitors page. The selected servers list is displayed on the right hand side, the servers can be selected or unselected by clicking the server name.
Historical Trend Graph
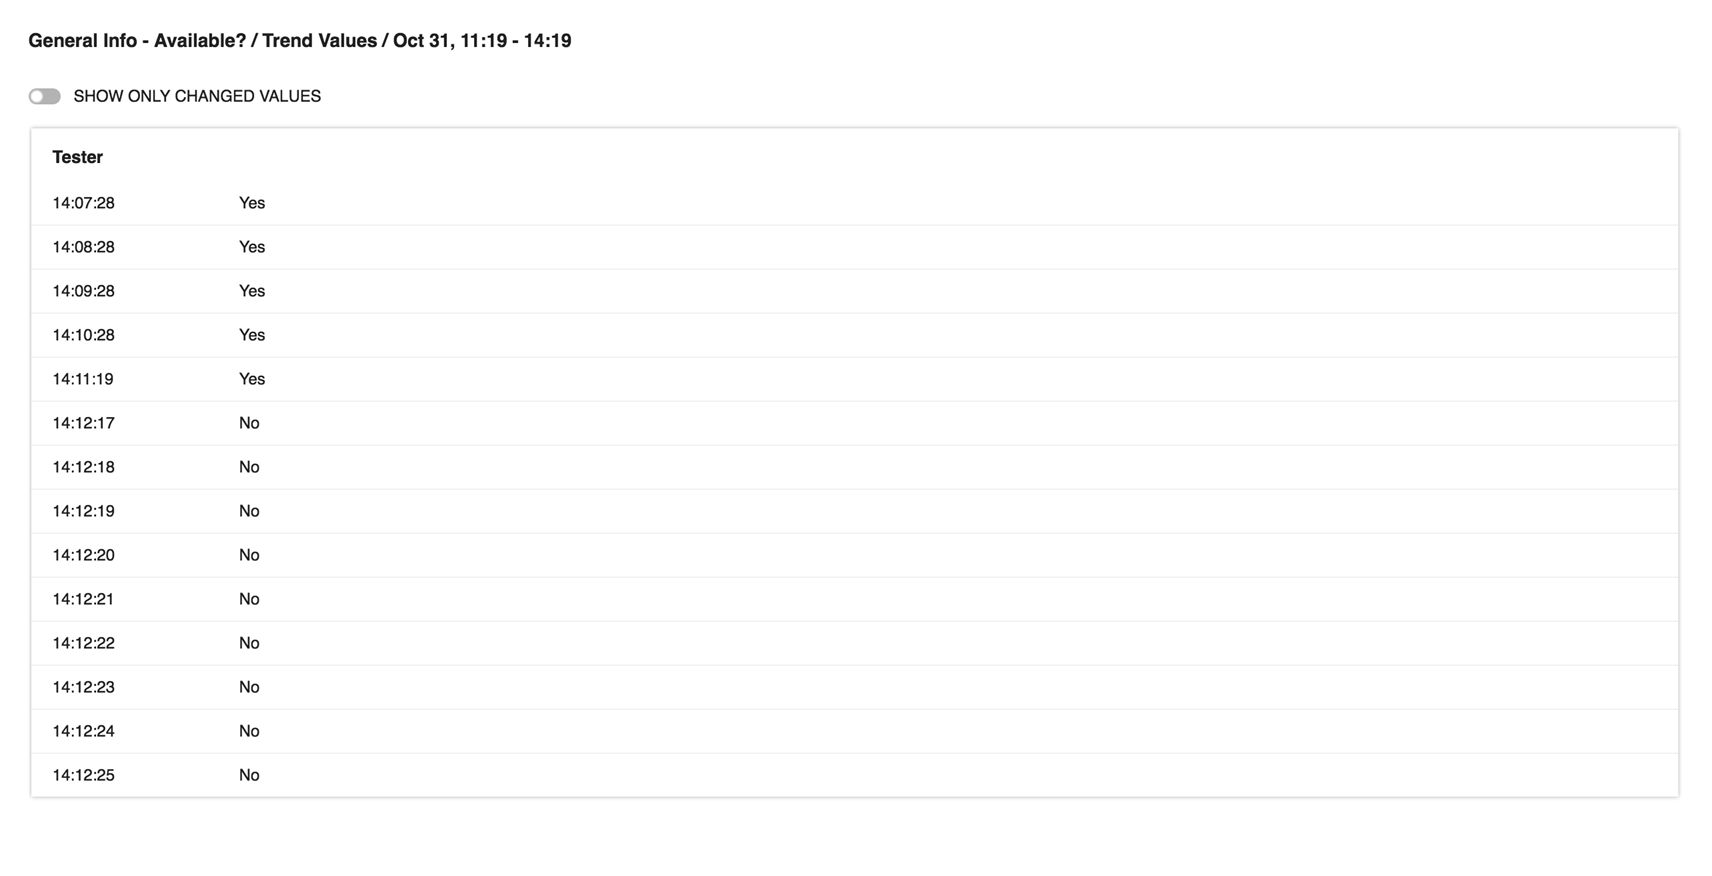
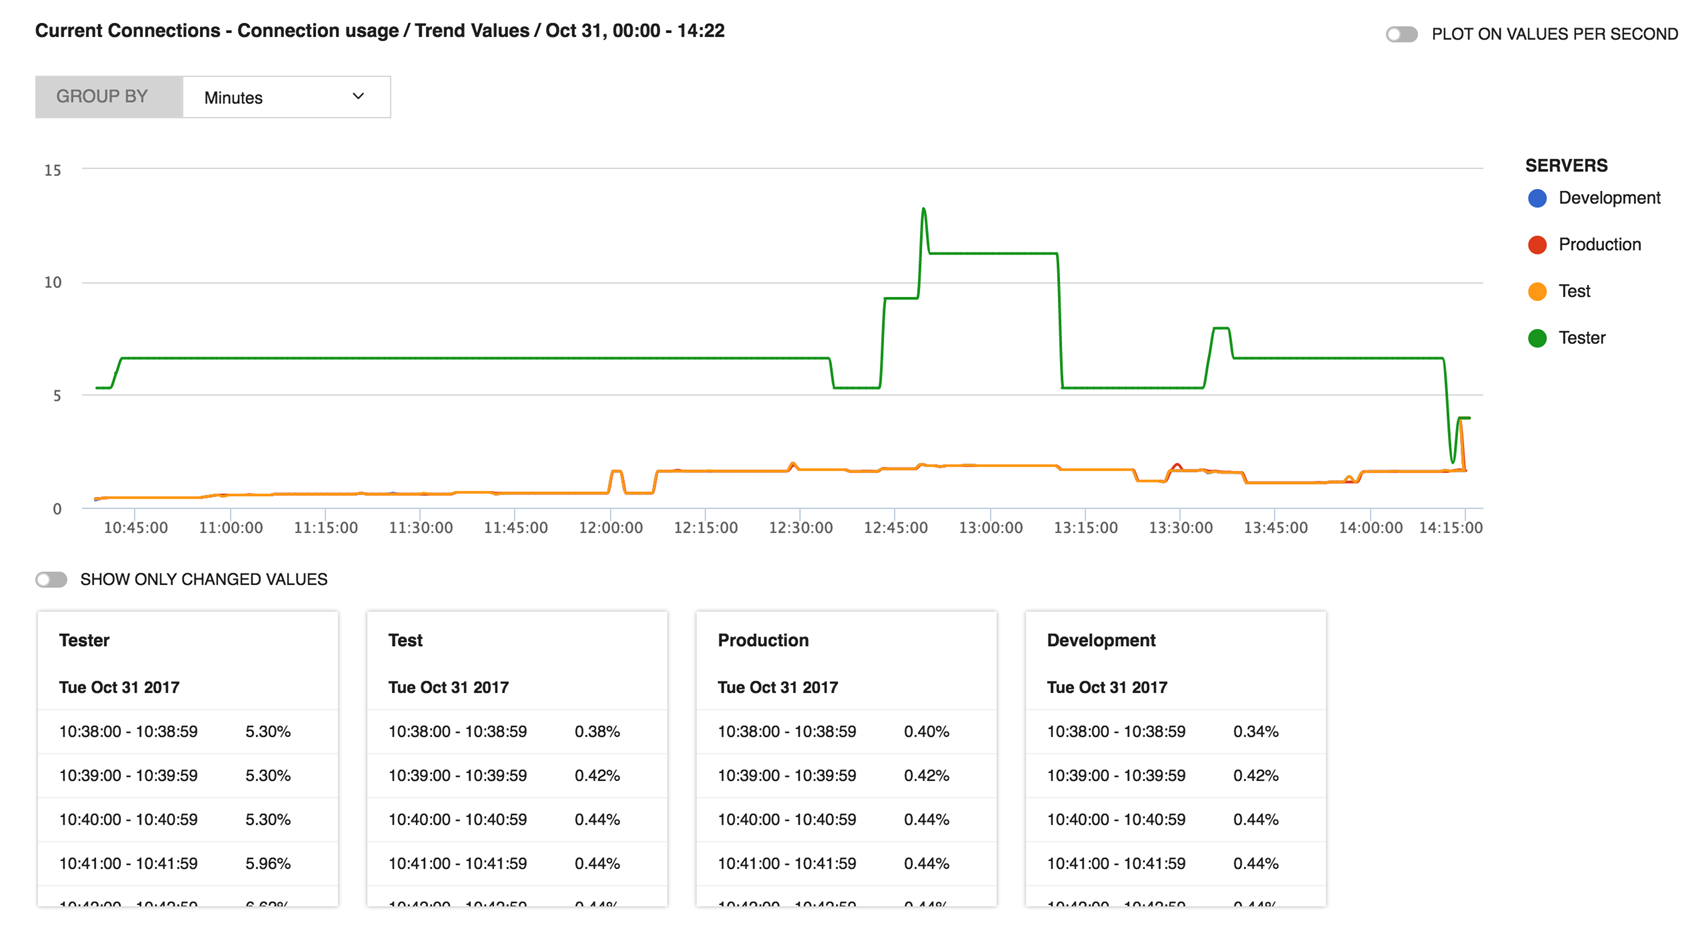
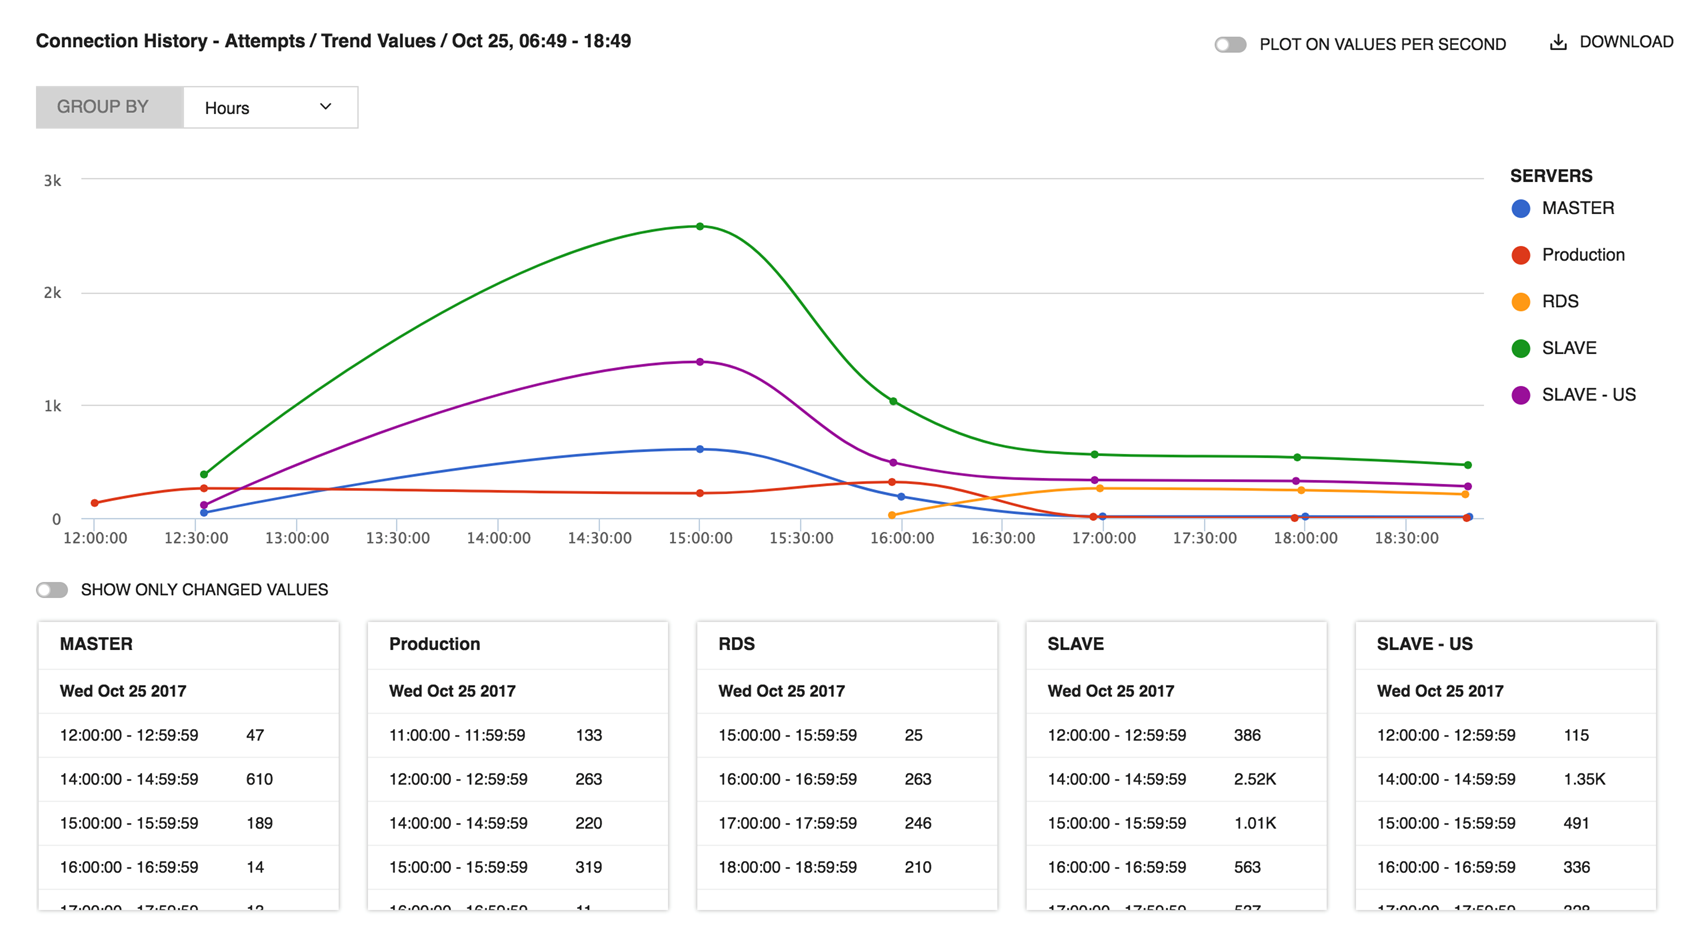
This is similar to the Current trend graph, the difference being that you can select any desired time-frame for which you want to see the graph for. You can choose the time-frame as History and then click the Trend Graph icon beside the counter name to see the graph. Along with the graph, it also shows the values of the monitor in the tabular form. Enable the option Show Only Changed Values to check when the monitor value was changed.
IDERA Website | Products | Buy | Support | Community | About Us | Resources | Legal


