IDERA Web Console is comprised of two main sub-views:
These sub-views display all data collected at the last refresh for all your monitored SQL Server instances. To access any sub-view, click the appropriate button in the left panel of the dashboard as shown in the following image:
Thumbnail sub-view
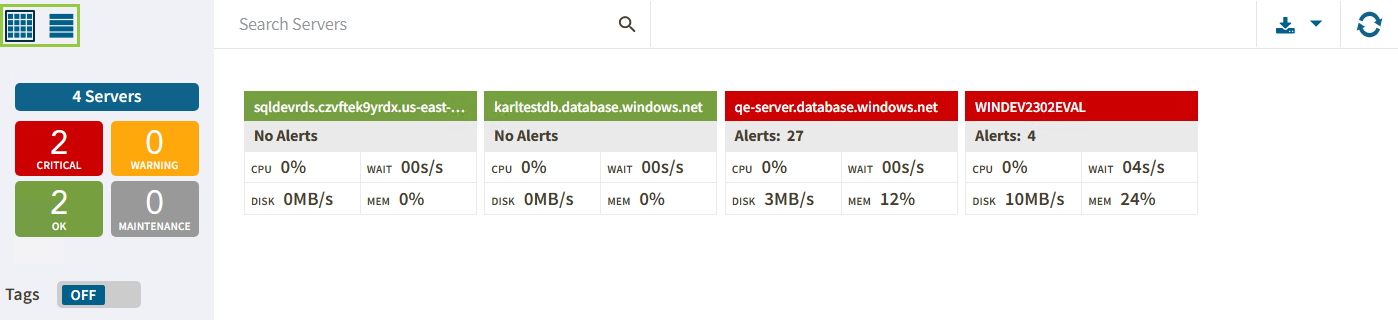
The thumbnail sub-view is the default view in the IDERA Web Console and provides you with a graphical replication of your monitored SQL servers. Access additional details in the single instance dashboard by clicking on a thumbnail’s instance.
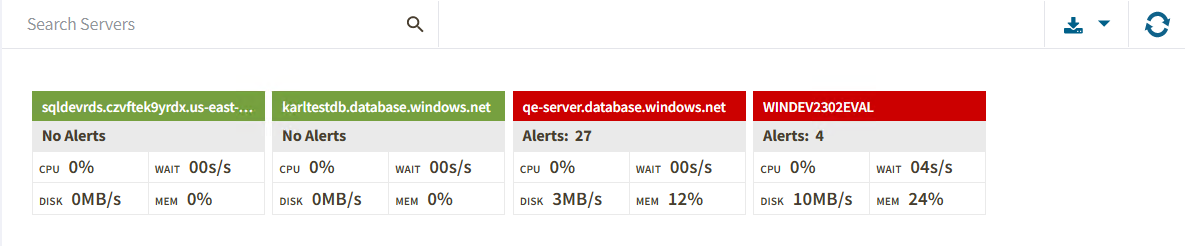
The thumbnail sub-view displays basic statistics about your SQL Servers:
Alerts/No Alerts
Displays the number of active alerts in the instance.
CPU Usage
Refers to average percentage of SQL Server processor usage on the computer hosting the SQL Server instance.
Server Waits
Disk I/O
Refers to the number of physical reads and physical writes made by the SQL Server instance between refreshes.
Memory Usage
Refers to the amount of memory in use by the monitored SQL Server instance.
Instances in thumbnail sub-view display according to severity. This means that critical instances show up on the top of the view.
List sub-view
The list sub-view offers a means to quickly identify the status of instances, as well as the possibility to navigate to the single instance dashboard when clicking on a specific row.
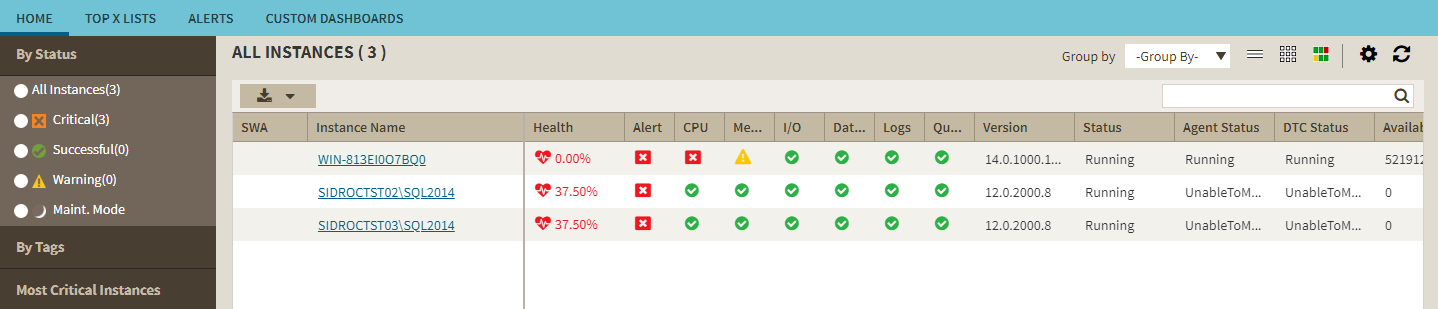
The list sub-view provides you with the following SQL Server information:
SWA
Displays the SWA icon when the instance is registered in SQL Workload Analysis.
Instance Name
Displays the name of the monitored SQL Server instance.
Health
Displays the health index in percentage in a red square.
Alert
Displays the current severity of the value of the instance.
CPU, Memory, I/O, Database, Logs, and Queries
Displays the overall health index icon for each option.
SQL Server Version
Displays the edition and version of SQL Server software used in this instance.
SQL Server Status
Displays the status of the SQL Server service such as running, stopped, and paused.
SQL Agent Status
Displays the status of the SQL Server Agent service such as running or stopped.
DTC Status
Displays the status of the Distributed Transaction Coordinator service such as running or stopped.
Available Memory (MB)
Indicates how much available memory is allocated for SQL Server.
Blocked Sessions
Displays blocked process sessions information on the SQL Server instance.
CPU Activity
Displays the percentage of CPU consumed by your SQL Server, virtual machine, and host server.
Disk Queue Length
Displays the average number of system requests that are waiting for disk access on the computer hosting the SQL Server instance
Actions
Sort
Instances on the list sub-view are sorted by severity. To re-organize information, click a column header or select the option to group by severity, tags, or SQLdmRepo (Group By).
Search Instance
Type the name of the instance you are looking for.
Options
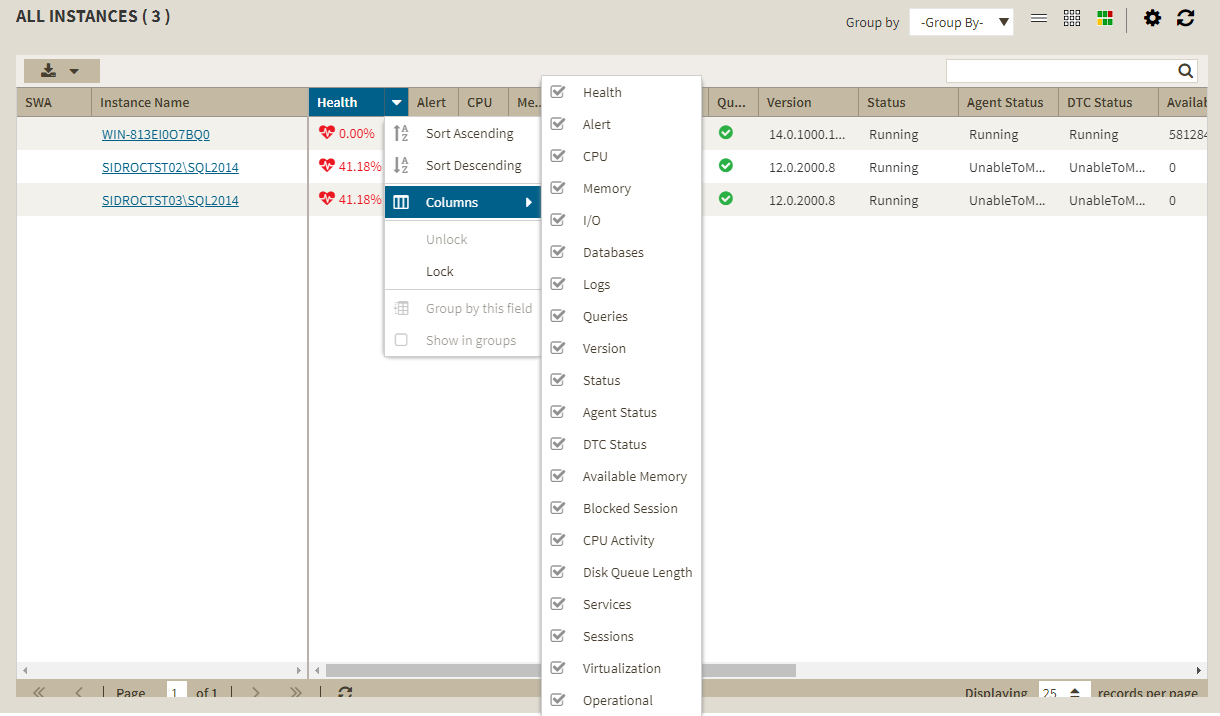
Choose the columns to display in the list view.
The Dashboard console has a new alert grid and custom filters that help you organize the list columns in your most convenient way. Click the ![]() icon located next to the column name to expand the drop down menu. This menu allows you to sort your criteria by Sort Ascending or Sort Descending, you can remove or add columns, lock and unlock, and group the information by fields.
icon located next to the column name to expand the drop down menu. This menu allows you to sort your criteria by Sort Ascending or Sort Descending, you can remove or add columns, lock and unlock, and group the information by fields.