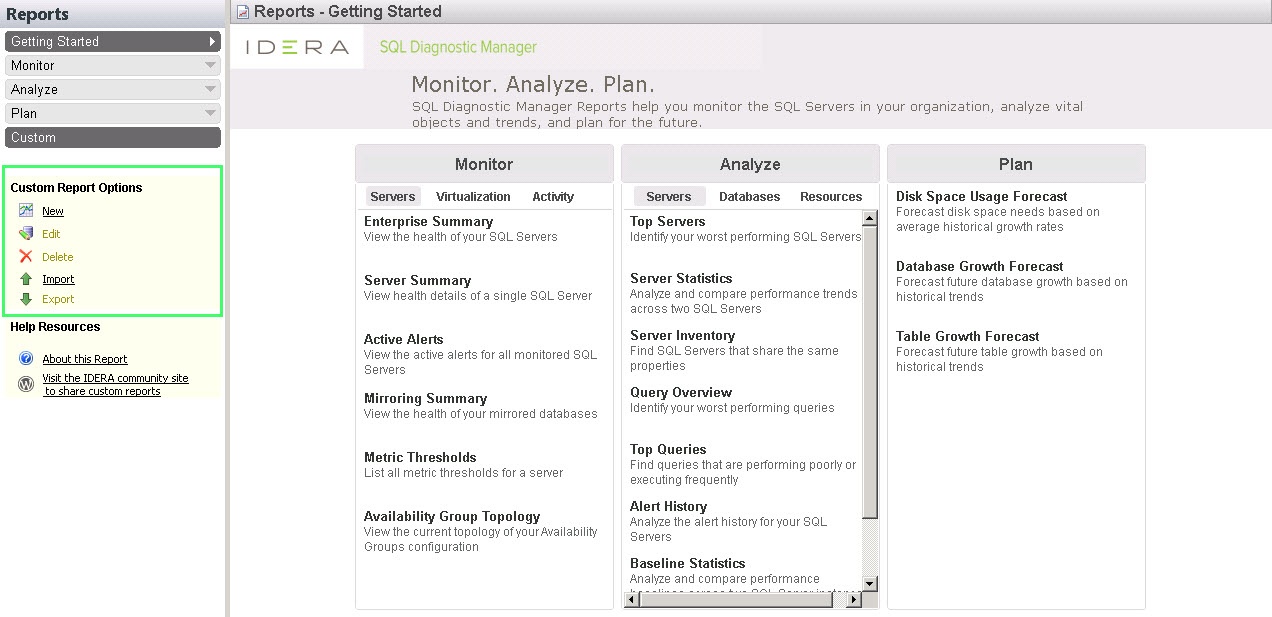
The Custom Reports view allows you to create, import or export reports on any counter collected by SQL Diagnostic Manager and on any of your custom counters. You can create custom reports to view graphs of the counters followed by a grid containing all of the counters graphed over the entered time frame.
Import and export custom reports
You can also import or share custom reports in the IDERA community site.
Access Custom Reports
SQL Diagnostic Manager provides two paths to access the Reports view where you can access your custom reports. The first access path is by clicking Reports in the Navigation pane. The second access path is by clicking Go > Reports. The second path is the only option if you hide your Navigation pane in the SQLDM Console.
Once in the Reports view, click Custom in the Navigation pane.
Filter your reports
Report filters are available by default. You can select the Server, Time Period, Date Range, and Sample type from the drop-down lists at the top of the report. If the filters are not displayed, click the Show Filters button.
Deploy reports to Microsoft Reporting Server
You can use the SQLDM Reports Deployment wizard to deploy specified reports to your Microsoft Reporting Server.
Edit or Delete an existing report
You can edit or delete an existing custom report by selecting the report name from the list displayed in the Reports pane, and then click Edit or Delete. To edit your report, use the Custom Report wizard.
Import or Export an existing report
You can import or export an existing custom report to the IDERA community site.
