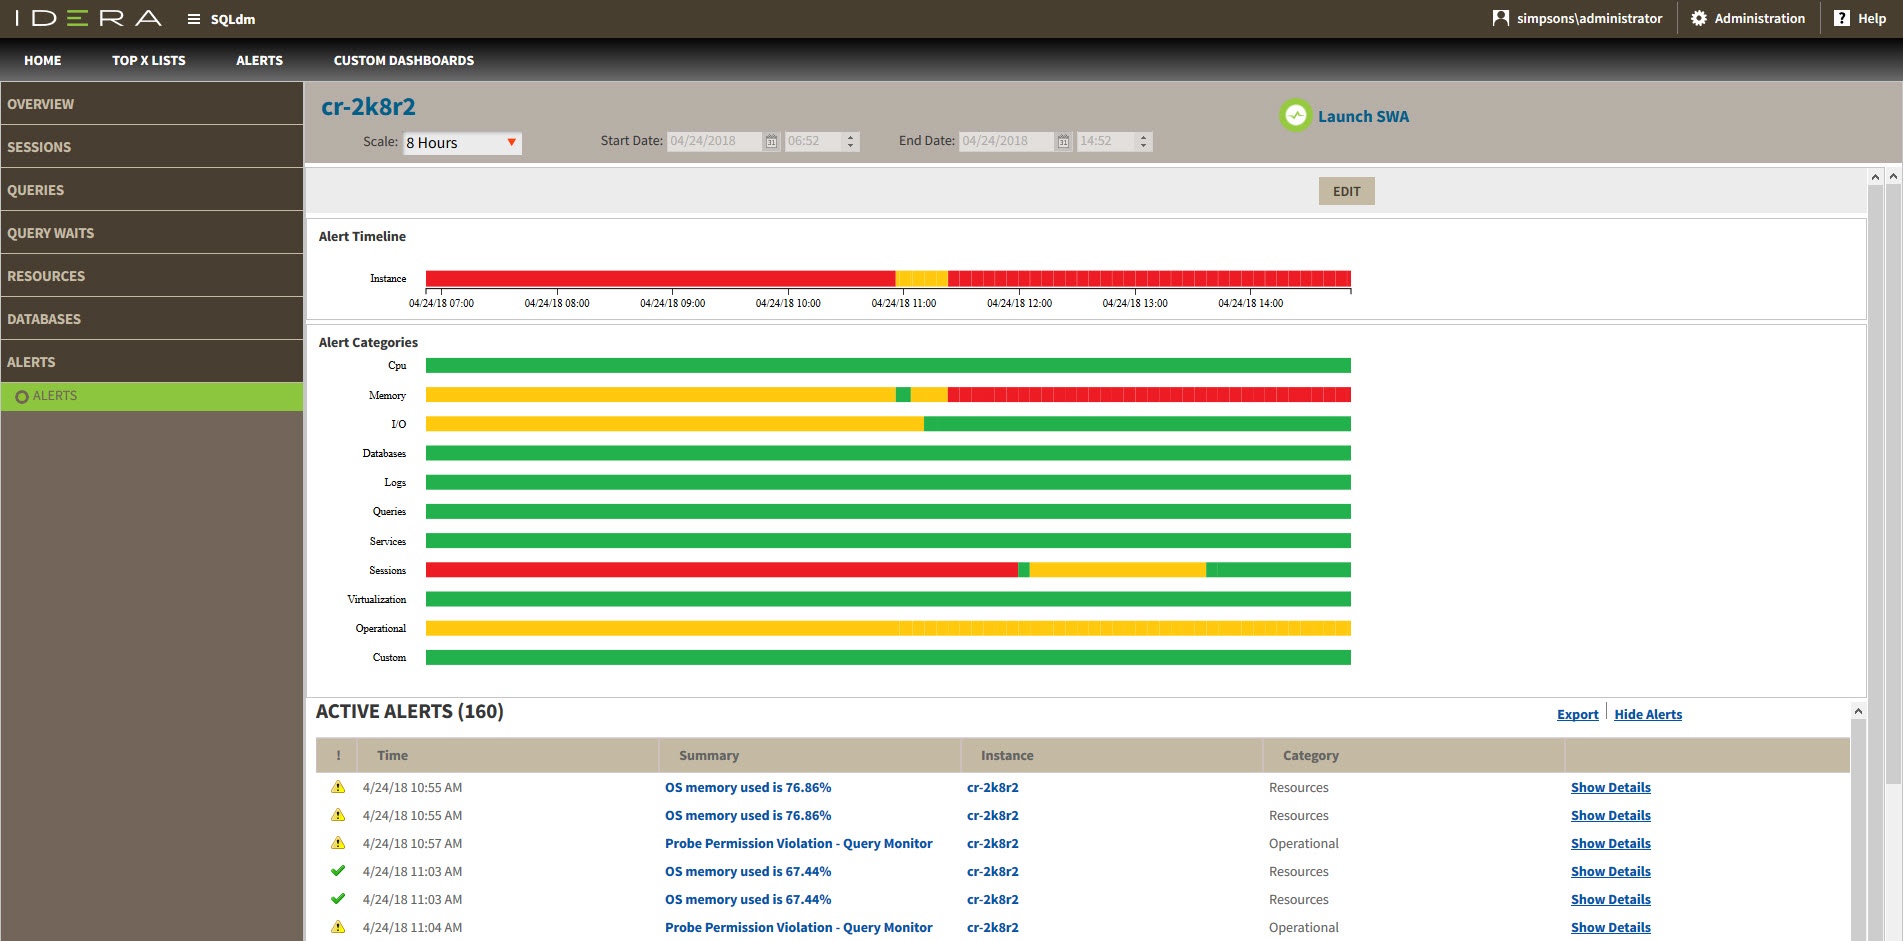
The Alerts tab of the single instance dashboard displays a color-coded alerts timeline view and an active alerts panel for the selected instance.
Color-coded alerts timeline view
The color-coded alerts timeline view allows you to easily identify the highest alert for your monitored SQL Server instance and the highest alert for a specific category. Each color in the alert timeline represents a different alert type. See the following table for more details:
| Alert type | Color | Meaning |
|---|---|---|
| OK | Green | The alert is in an acceptable threshold. |
| Warning | Yellow | The alert reaches a Warning threshold. |
| Critical | Red | The alert reaches a Critical threshold. |
Filter your alert results in the Alerts tab by specifying a timeframe or by selecting default timeframes of 8 hours, 1 day, 5 days, or 4 weeks. Click image to display in full size view.
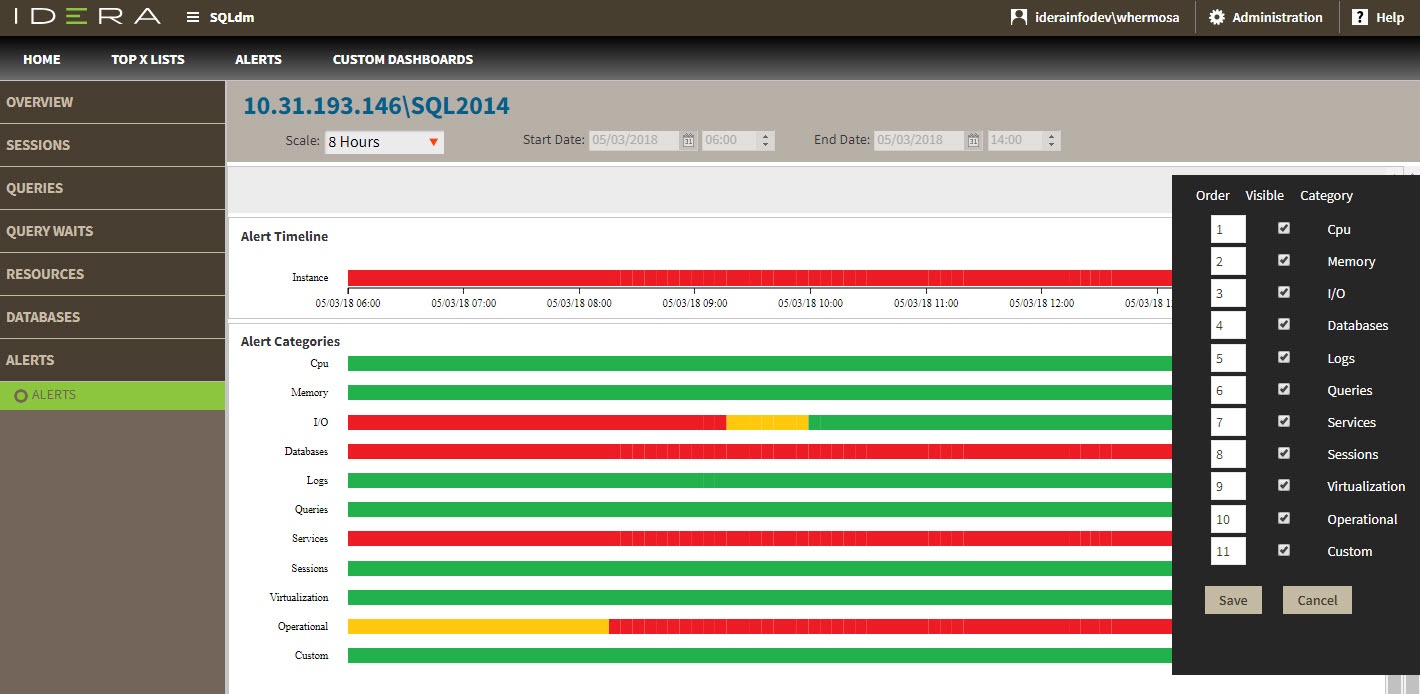
You can also filter your alert results by alert category or categories’ order. Click Edit to order and select the categories you want to display in the Alerts timeline view.
Active alerts panel
The Alerts tab also lists all the active alerts of your monitored SQL Server instance over a period of time. The active alerts panel provides the following information:
Alert type
Shows alert type icon:for OK alerts, for Warning alerts, and for Critical alerts.
Time
Indicates date and time of alert inception.
Summary
Displays alert description.
Instance
Displays the name of the monitored SQL Server instance.
Category
Indicates alert category.
Additional options
In the Active alerts panel of the single instance dashboard, you can select the following additional options:
Show alert details
View additional information on a specific active alert by clicking Show Details.
Export
Export your alerts information in PDF, XLS, and XML.
Show/Hide Alerts
Choose to show or hide active alerts.

