In this step, you will execute your Department Maintenance web page (iiiMaintDepartment) which you created in the previous exercise, using the debugger. The form must have been compiled with debug enabled.

1. Review Debug settings. Open the LANSA Settings dialog from Options in the File menu. Select Debug settings:

Note that debug may be set to break at the first executable statement. This means a breakpoint is not necessary.
When you have breakpoints defined, you may want to change this setting, so that debug breaks on your breakpoints only.
Note that Debug is a Windows Service using a specific Port. It is possible to change this port number if required by your network administration.
2. Interactive Debugging must be enabled in using the Web Administrator / Miscellaneous tab:
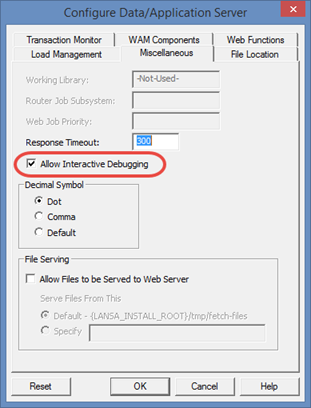
See the Web Administration Guide. The Web Administrator is run from the LANSA Settings and Administration folder.
3. With the Maintain Department web page open in the editor, execute it in debug mode using the Debug button.

4. The web page will start to open in the browser but, since debug has stopped at the first executable statement, no output will be shown. Switch to Visual LANSA.
Ideally, execute the browser and Visual LANSA side by side or on different screens.
The first executable statement will be highlighted with a yellow background.
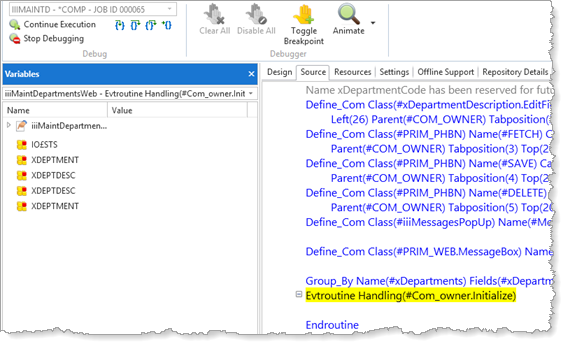
In this example, the Initialize event for the web page is highlighted in yellow.
The Debug ribbon is displayed and a Variables tab on the left displays all the web page variables and their values.
Debug is now waiting for commands and the web page will not continue execution until you click a debug command button.
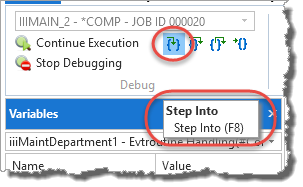
5. Hover the cursor over a toolbar button to see its tooltip: