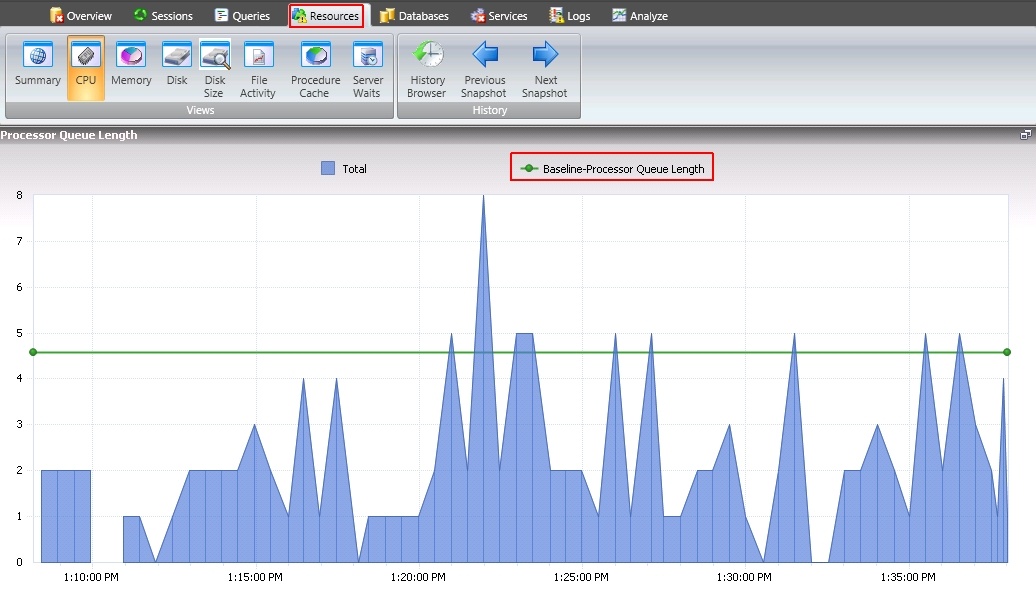
SQL Diagnostic Manager allows users to view the baseline in effect in various metric graphs of the Resources tab.
View baseline in effect in the following graphs:
In the Resources > CPU view:
- CPU Usage
- Processor Queue Length
- Processor Time
- CPU Usage
In the Resources > Memory view:
- SQL Memory Usage
- Paging
- Cache Hit Ratios
- Page Life Expectancy (sec)
In the Resources > Disk view:
- Disk Busy Per Disk
- Average Disk Queue Length Total
