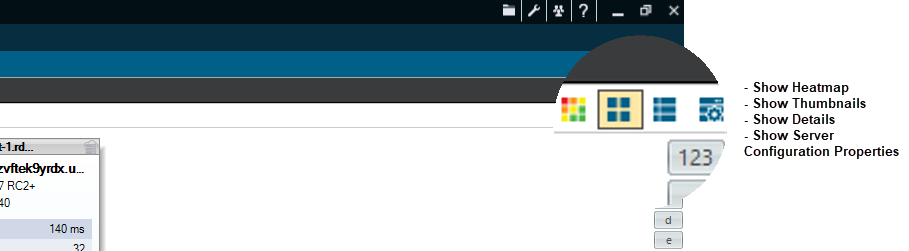
SQL Diagnostic Manager allows you to monitor multiple instances using different views, such as heatmap, thumbnails of mini-monitors, a list of instances and their important details, or a list of instances and their server properties. SQL Diagnostic Manager defaults to the thumbnail view.
If any metrics are missing from this view you may need to enable OS metrics collection.
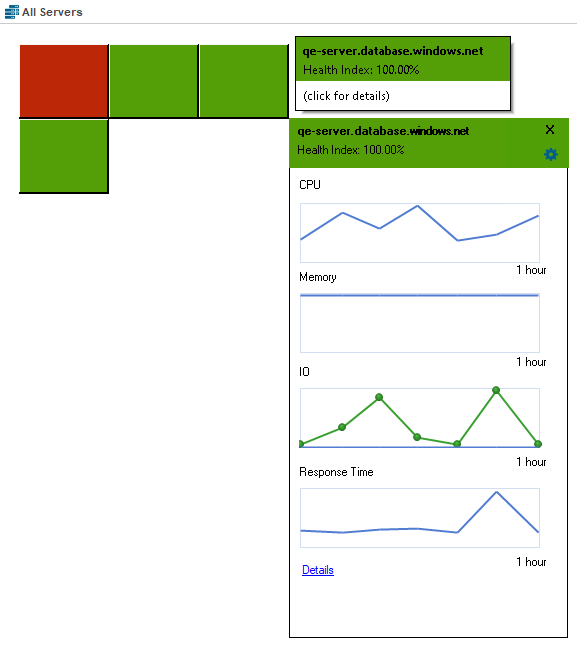
Heatmap
The heatmap sub-view provides a visual overall status of your SQL Server environment in the form of a grid of color-coded squares that contain a health index. Through its color scheme and health index, you can easily identify which of your monitored instances needs the most attention. Each square in the heatmap sub-view represents a monitored instance. With each square, you can access basic statistics, drill down for details, and the health index as well.
Additionally, you can access the Health Index of each instance and make some calculations.
Health Index
The Health Index is a percentage value that provides an estimate of the relative health of your monitored SQL Server instance. The Health Index is based on the following raw calculations:
Health Index Raw Calculation = Instance or Tag Scale Factor * (#Critical Alerts * Critical Scale Factor + #Warning Alerts * Warning Scale Factor + #Informational Alerts * Informational Scale Factor)
The raw score is normalized between a 100% and 0% range. SQL Server is healthier the closer its health index is to 100% and it is in a critical state the closer its health index is to 0%.
Use the severity factors to change the relative weight in the calculation. Use tag and instance factors to assign instances of more or less importance in the overall heat map ranking.
The Health Index wizard allows you to make calculations by configuring the scale factor and selecting the instances and tags for each calculation. To do so, follow the next steps:
- Click one of the Heatmap's squares. When the heatmap sub-views appear, click the gear icon
 to display the Health Index wizard.
Type the Alerts Scale Factor fields with the values of your preference.
IDERA recommends Alert Scale Factor's values fall between zero and ten.
- Choose an instance from the registered instances dropdown, set a distinctive scale factor, and click
 to add it to the calculations. You can add as many instances as you need by repeating the process. To disable an instance, click
 .
. - Follow step 3 in the Tag section, to add the tags you need.
- Click Submit.
Thumbnails
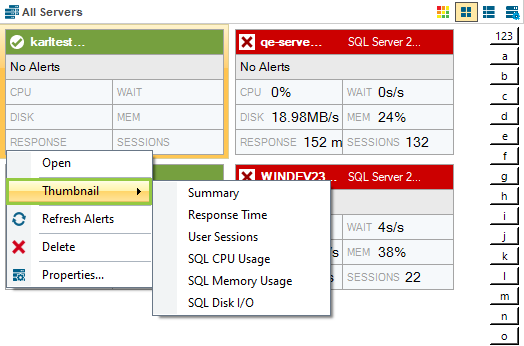
The thumbnail sub-view is the default view in the SQL Diagnostic Manager web console's dashboard and provides you with a graphical replication of your monitored SQL servers. Access additional details in the Single Instance Dashboard by clicking on a thumbnail’s instance name or easily spot categories that have active alerts as marked by a critical icon.
To customize your view:
- Click All Servers under the SERVERS screen.
- Under the All Servers main screen, right-click the instance you want to customize, select Thumbnail, and select the information type you want to display on it
Instead of listing statistics for the server, SQL Diagnostic Manager displays the individual chart of the data item you selected. To revert, select Summary from the Thumbnail list.
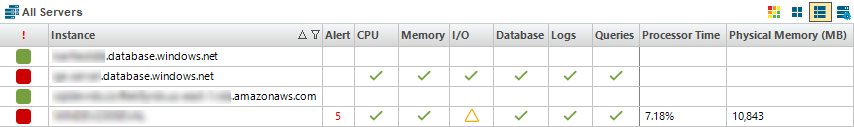
These views list all the data collected at the last refresh for all your monitored SQL Server instances. The Details and Server Configuration Properties views can assist you with comparing the status of a specific metric or property between two or more of your SQL Server instances.
Details
This view allows you to see the overall status of your monitored instances and specific information based on the metrics you configured.
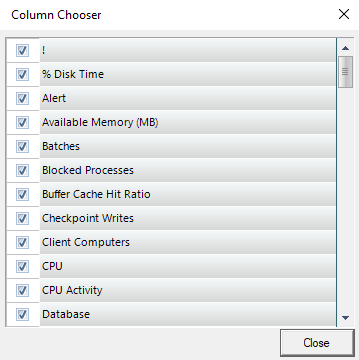
To configure the columns in this view, follow these steps:
- Right-click any title top row of the main Details screen and select Column Chooser.
- Check or uncheck the options you want to add or remove for this view.
Add a custom view
You may want to add a custom view to the My Views list to organize your SQL Server instances into specific groups for monitoring purposes. This is especially important if you are monitoring a large number of SQL Server instances and want information for a specific group of SQL Server instances. To make it easier to monitor your SQL Server instances using SQL Diagnostic Manager, it is recommended that you create views beforehand. This way, you can simply select the view and add any new instances to it, instead of adding each instance individually. To add a new view:
- To create a new view from the Files menu, select
 > Create View. To create a new view from My Views, right-click within the My Views section, and select Create View.
 - Type a name for the view.
- Select the monitored SQL Server instances you want to include in this view.
- Click Add > to move the selected instances from Monitored Instances to View Instances.