Use the Alert Response window to create or modify your new alert response rule.
Access the Alert Response window
- Select
 > Alert Actions and Responses.
Add a new rule
- Click Add on the Alert Responses tab of the Alert Actions and Responses dialog box.
- Enter a Name for the rule.
- Check the boxes for the conditions and destinations for the rule.
- Click Enable to activate the associated action. Note that all actions are disabled by default.
- If you enabled an action, provide any required information for the selected action.
- Click Add to select additional actions to perform in response to the alert. This feature allows you to add multiple instances of certain actions.
- Click the hyperlink text to select specific conditions for the rule.
- Click OK when finished.
Available conditions
By default, alert response rules are not limited to specific SQL Server instances, metrics, severity levels, and times. You can use conditions to tailor the triggers of your alert responses. The following conditions help you manage alert response rules.
Where the SQL Server Instance is in specified list
Trigger a response when the listed SQL Server instance is included in the displayed list. Click specified list and then select one or more instances to include in the alert response trigger. Click Select all to include all of the displayed instances.
Where SQL Server Instance has a tag in specified list
Trigger a response when the listed SQL Server instance contains a tag in the displayed list. Click specified list, and then select one or more tags to include in the alert response trigger. Click Select all to include all of the displayed tags.
Where the metric is in the specified list
Trigger a response if the metric is included in the displayed list. Click metric and then select one or more metrics to include in the alert response trigger. Click Select all to include all of the displayed metrics.
Where all metrics are in the specified list
Trigger a response only if multiple metrics in the specified list reach the specified threshold(s). Click metric and then select metrics to include in the alert response trigger. Click Select all to include all of the displayed metrics.
Where metric severity has changed
Trigger a response when the metric severity changes regardless of level. Click the displayed severity level and then select one or more severity levels to include in the alert response trigger.
Where refresh occurred during a specific time frame
Trigger a response if the refresh occurred during the displayed time frame. Click during this time and then select the time and date range to set the alert response trigger time frame.
Where Alert Rank value
Trigger a response based on its rank value. Click value, select the condition from the dropdown menu (greater than, less than, or equal to), and set the alert response trigger value (between 1 and 100).
Where metric severity is unchanged for a specific time period
Triggers a response when a metric’s severity remains unchanged for a specified duration. The timer starts when the metric enters its current severity level and is evaluated once for that unchanged state.
After the specified time period is met, this condition no longer suppresses responses based on elapsed time. The timer does not restart or retrigger at regular intervals. The condition is only re-evaluated if the metric severity changes and then remains unchanged again for the specified time period.
Set the trigger time period in minutes (between 1 and 1000 minutes).
Available action providers
Action providers allow you to select actions you want to occur as part of the alert response. By default, all actions are disabled. To enable an action, click Enable next to the appropriate action. The following actions help you manage alert response rules:
- Email (SMTP) Provider
- EventLog Action Provider
- Network Management Protocol (SNMP) Trap Message Provider
- PowerShell Action Provider
- Prescriptive Analyzer Action Provider
- Program Action Provider
- Query Monitor Action Provider
- Query Waits Action Provider
- SCOM Alert Action Provider
- SCOM Event Action Provider
- ServiceNow Action Provider
- SQL Agent Job Action Provider
- SQL Script Action Provider
Email (SMTP) Provider
When the criteria for the new alert rule is met, SQL Diagnostic Manager sends an alert email message to the SMTP server, which then forwards the message to the specified email address. Configure your email settings and network manager settings to receive these alert email messages.
EventLog Action Provider
When the criteria for the new alert rule is met, an entry to the EventLog is created.
Network Management Protocol (SNMP) Trap Message Provider
When the criteria for the new alert rule is met, SQL Diagnostic Manager sends an SNMP Trap message to the network management console based on the configuration of your email settings and network management settings.
PowerShell Action Provider
When the criteria for the new alert rule is met, you can specify a PowerShell script to run in response to the alert.
To run a PowerShell script as an alert response:
- Enable the PowerShell Action provider and the PowerShell Action dialog displays.
- Enter a description for the PowerShell command in the Description field.
- Either type in the PowerShell command you want to run when the alert criteria is met, or paste in the PowerShell command from another application.
- Click Test to verify your PowerShell command.
- Click OK.
Prescriptive Analyzer Action Provider
When the criteria for the new alert rule is met, it triggers the Prescriptive Analyzer to run a prescriptive analysis on a specific server based on selected performance categories.
To enable the prescriptive analyzer as an alert response:
- Enable the Prescriptive Analyzer provider and the Prescriptive Analysis Settings window displays.
- Select the performance categories of your choice.
- Click OK.
Program Action Provider
When the criteria for the new alert rule is met, you can specify a program for the SQLdm Management Service to run in response to the alert.
To start a program as an alert response:
- Enable the Program Action provider and the Program Action dialog displays.
- Enter a description for the Program action.
Enter the full path to the program you want to launch as an alert response. Use the More Options drop-down menu to select from common runtime arguments.
You can run executable (.exe) files only through the Program Action Provider. If you need to run a batch (.bat) file, use
cmd /c run.bat.Enter the full path of the directory in which you want the program to run.
The Start in field is useful when you want a different directory for where an action begins and where the program resides.
- Click Test to make sure that the SQLdm Management Service can run the program.
- Click OK.
Query Monitor Action Provider
When the criteria for the new alert rule is met, it triggers the Query Monitor to start so that you can collect more information.
To enable query monitor as an alert response:
- Enable the Query Monitor provider and the Query Monitor Settings dialog displays.
- Select either Enable query monitor to enable the query monitor until it is manually disabled or Enable query monitor for a limited time.
- Click OK.
Query Waits Action Provider
When the criteria for the new alert rule is met, it triggers the Query Waits to start so that you can collect more information.
To enable query waits as an alert response:
- Enable the Query Waits provider and the Query Waits Settings dialog displays.
- Select either Enable query waits to enable the query monitor until it is manually disabled or Enable query waits for a limited time and configure the duration.
- Click OK.
SCOM Alert Action Provider
When the criteria for the new alert rule is met, SQL Diagnostic Manager sends an alert to SCOM.
To create SCOM alert response:
- Send to SCOM as Alert option.
- Select the metrics you want to be sent to SCOM as alerts. You can also select all available metrics.
- Click OK.
SCOM Event Action Provider
When the criteria for the new alert rule is met, SQL Diagnostic Manager sends an event to SCOM.
To create SCOM alert response:
- Send to SCOM as Event option.
- Select the metrics you want to be sent to SCOM as alerts. You can also select all available metrics.
- Click OK.
ServiceNow Action Provider
When the criteria for the new alert rule is met, SQL Diagnostic Manager sends an alert to ServiceNow.
To enable ServiceNow as an event:
- Enable Send ServiceNow as Event option.
- Provide the following information regarding the ServiceNow configuration:
- Provider Name. By default, ServicerNow Action Provider
- URL. For now, use the following link:
https://instancename.service-now.com - Upload As. Select Event from the drop-down list.
- User Information
- Username.
- Password.
- Alert Source. By default, SQL Diagnostic Manager.
- Click OK.
To enable ServiceNow as an alert:
- Enable Send ServiceNow as Alert option.
- Provide the following information regarding the ServiceNow configuration:
- Provider Name. By default, ServicerNow Action Provider
- URL. For now, use the following link:
https://instancename.service-now.com - Upload As. Select Alert from the drop-down list.
- Table Name. Type the desired table name in the text field.
- User Information
- Username.
- Password.
- Alert Source. By default, SQL Diagnostic Manager.
- Click OK.
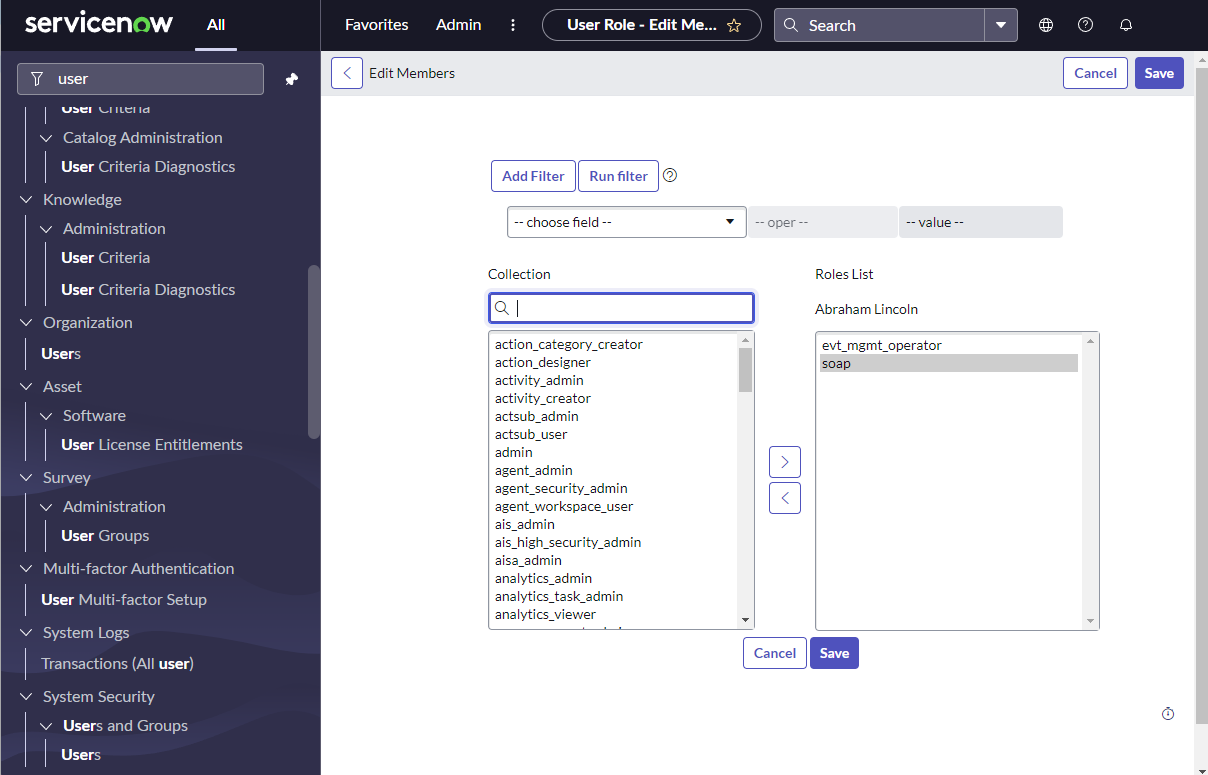
Keep in mind that you should have an evt_mgmt_operator and soap user role for basic authentication for ServiceNow integration.
Consider that the Provider Name and the Alert Source are descriptive fields. You can leave them with default values or edit them to your preference.
SQL Agent Job Action Provider
When the criteria for the new alert rule is met, you can specify a SQL Agent Job to run in response to the alert.
To start a SQL Agent Job as an alert response:
- Enable the SQL Agent Job Action provider and the SQL Agent Job Action dialog displays.
- Select the SQL Server instance from the Server drop-down list or select %(Instance) to run the SQL Agent Job on the server that caused the alert.
- Click Browse next to the Job Name field.
- On the Select Job window, select the SQL Server instance the SQL Agent Job is located on and click Load.
- Select the SQL Agent job from the list and click OK.
- If you want to select a particular Job Step to run, click the Browse button in the Job Step window
- In the Select Job Step window click Load.
- Select the Job step from the list and click OK.
- Click Test to verify your configuration.
- Click OK.
SQL Script Action Provider
When the criteria for the new alert rule is met, you can specify a SQL Server script to run in response to the alert.
To run a SQL Script Action Provider as an alert response:
- Enable the SQL Script Action provider and the SQL Script Action dialog displays.
- Enter a description for the SQL Script Action in the Description field.
- Click Browse to select the SQL Server instance or leave it at the default of %(Instance) to run the SQL Script on the server that caused the alert.
- Either type in the T-SQL you want to run when the alert criteria is met or paste in the T-SQL from another application.
- Click Test to verify your SQL script.
- Click OK.
Change the condition value
You can edit the rule description by clicking the underlined value from the Step 3 section. SQL Diagnostic Manager displays a list of currently defined items for you to select as the new value. Make the necessary updates, and then click OK.