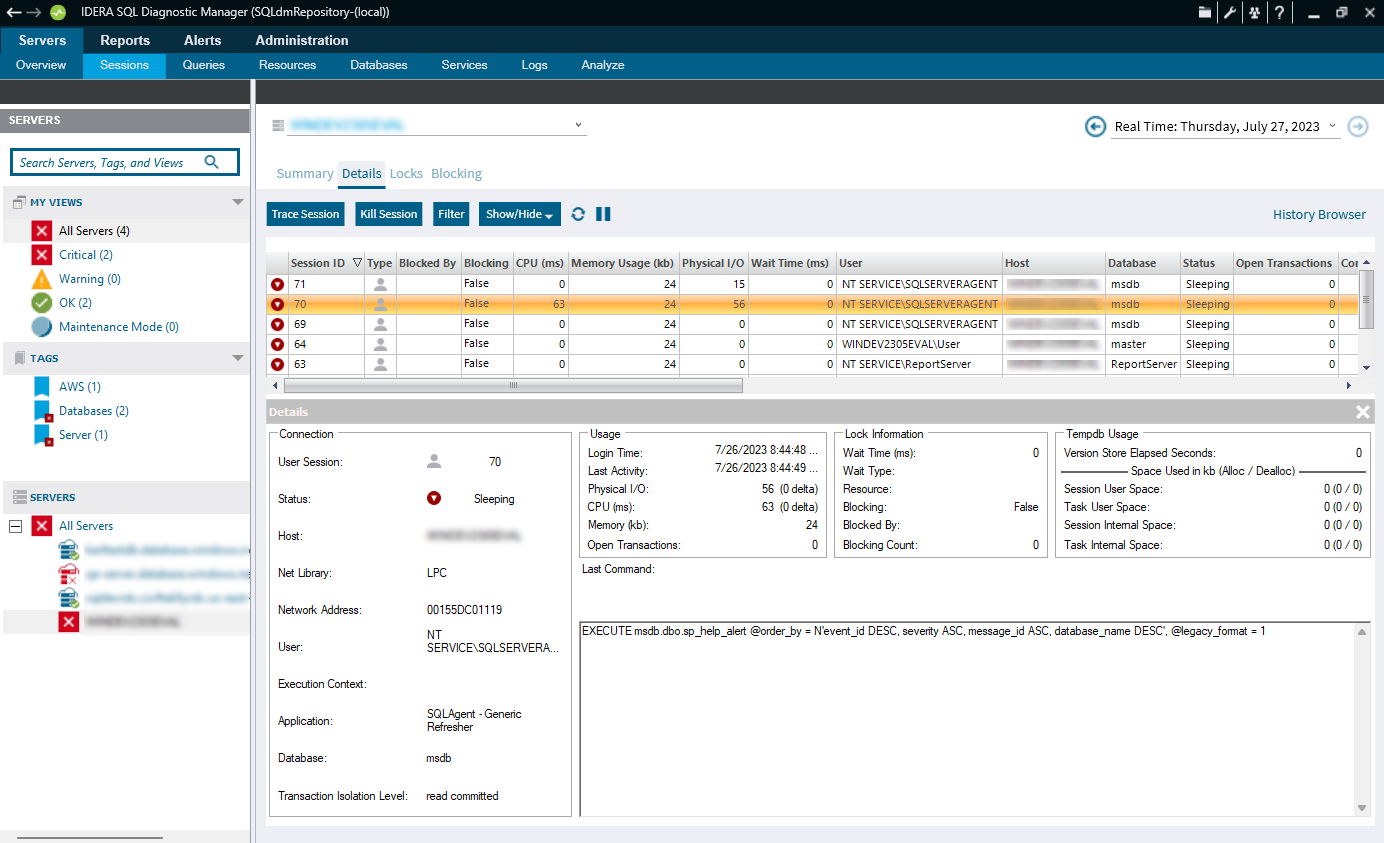
The Sessions Details view provides an in-depth analysis of sessions running on your monitored SQL Server instance. You can view a wide range of information from performance details to open transactions and configured options or track process activity at the statement level. Individual sessions appear in the top portion of the window.
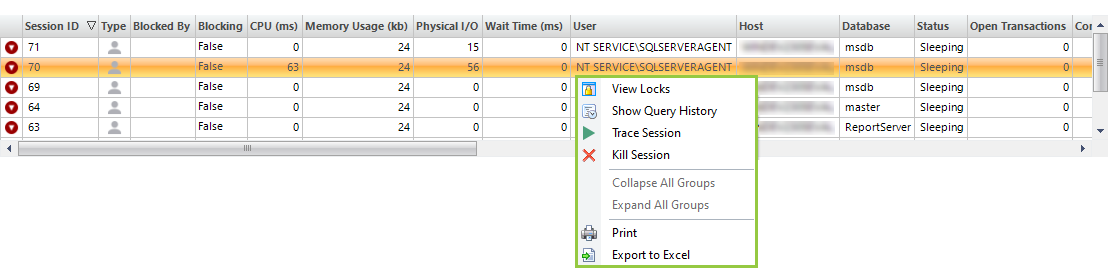
Right-click any session in the list to View Locks, Show Query History, Trace Session, Kill Session, Print the associated statistics, or Export statistics to Microsoft Excel.
When you select a session, SQL Diagnostic Manager displays the statistics for that session in the Details section at the bottom of the window. This section includes in-depth information regarding the session Connection, Usage, Lock, and Tempdb usage.
Access the Details view
To open the Details view of the SQL Diagnostic Manager Sessions select the appropriate SQL Server instance, and click Sessions > Details.