SQL Diagnostic Manager allows you to launch SQL Workload Analysis in context of your monitored server from the desktop console and the web console. SQL Workload Analysis dashboard displays trending database activity and top utilizing SQL statements, logins, machines, and programs. SWA provides a granular breakdown of the SQL Sever wait states with easy drill-down isolate problems quickly. View real-time and historical data to help tune queries and actionable recommendations to improve performance. For more information, see the SQL Workload Analysis Online Help.
Launch SQL Workload Analysis
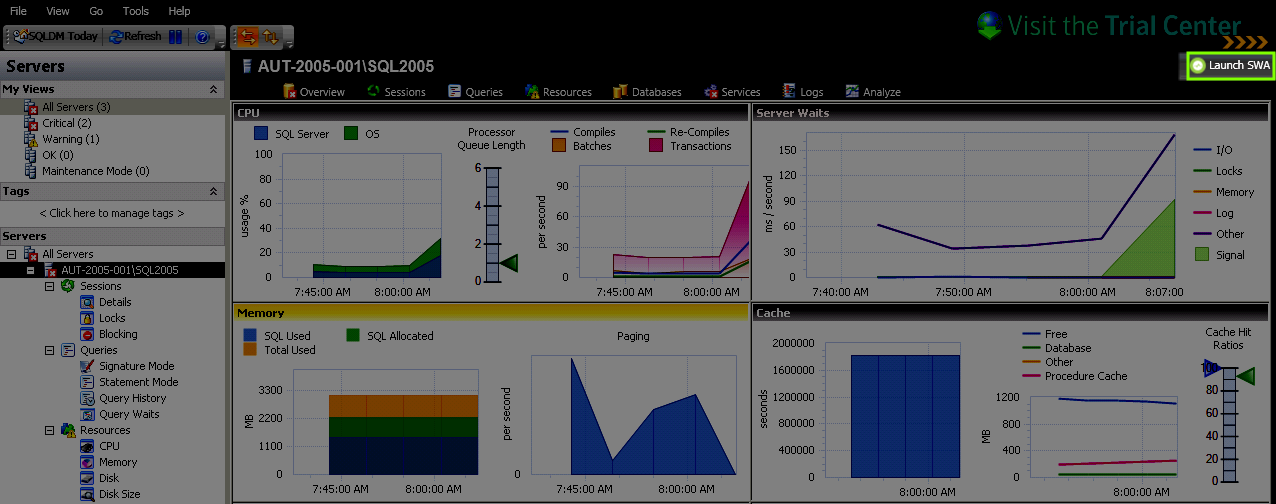
In the desktop console, the Launch SWA icon is located on the top-right side of your monitored server screen.
SQL Diagnostic Manager only displays the Launch SWA button for those instances that are also registered in SQL Workload Analysis.
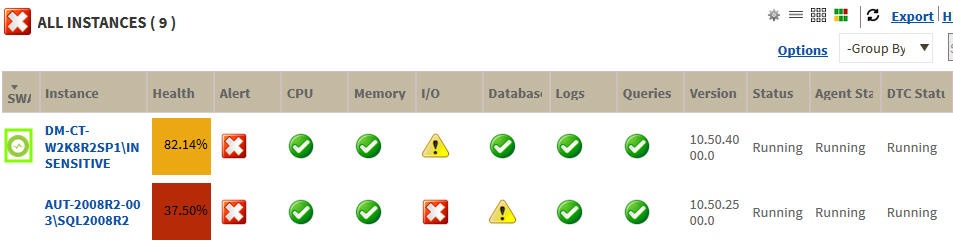
In the list view of the web console, the listed instances are well identified with the SWA icon when they are registered in SQL Workload Analysis.
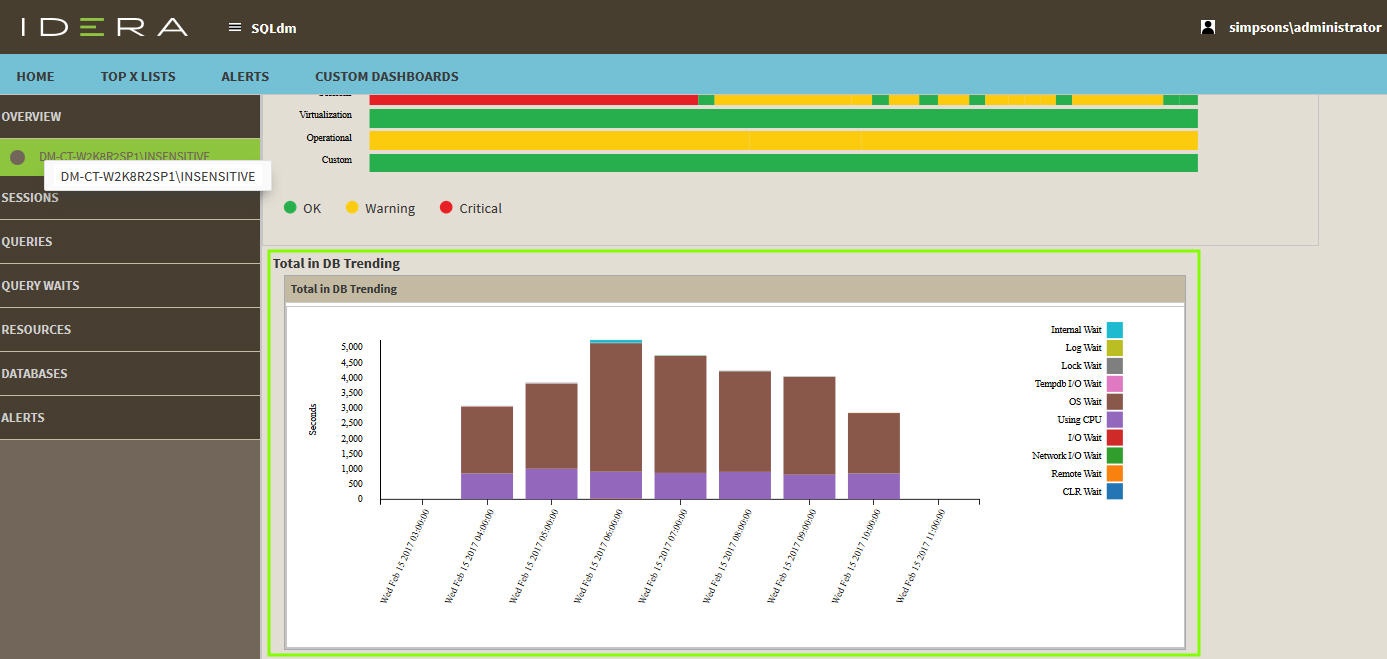
In the single instance view, you can be redirected to SQL Workload Analysis by clicking the graph "Total in DB Trending".
Time-based drilldown in SQL Diagnostic Manager
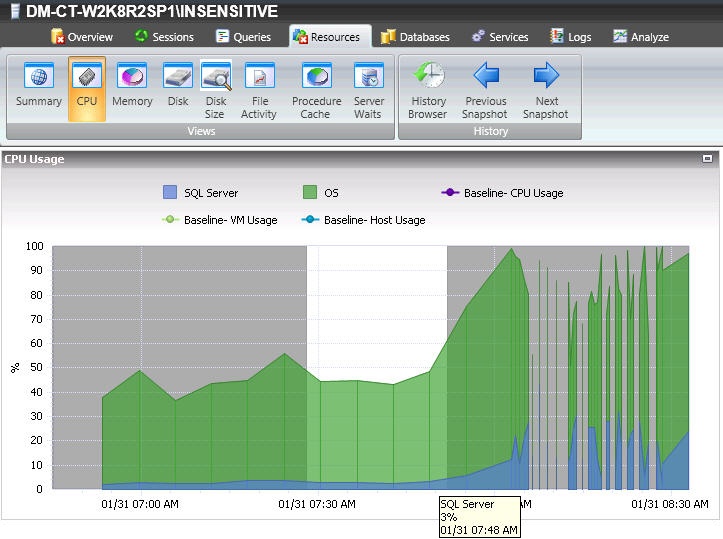
In both Windows Client and IDERA Dashboard, select any time range on any graph available and zoom in for more detail and isolate that time range as you navigate to other graphs.
To select anytime range, follow these steps:
- Click the graph (Use any graph in the SQLDM desktop console or SQLDM web interface).
- Hold the left mouse button on the time position that is needed.
- Drag it to the left or to the right, and release the button.