The Alerts Detail screen in the SQLdm web console provides you with detailed statistics on your alerts.
On the Alerts Detail screen you can find the following information:
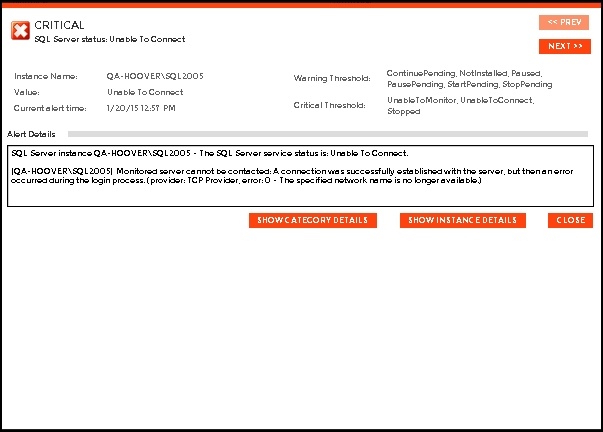
- Alert Name
- Instance Name
- Value (description)
- Warning Threshold
- Critical Threshold
- Current alert time
- Alert Details
Additional button options
Category
Click the SHOW CATEGORY DETAILS button to access first the Overview tab of a single instance and then specific category views such as sessions, queries, query waits, resources, databases, and alerts.
Instance
Click the SHOW INSTANCE DETAILS button to access the single instance dashboard for a specific instance.
Close
Click the CLOSE button to exit the Alerts Detail screen.
Prev
Click the PREV button to view details for a previous alert.
Next
Click the NEXT button to view details for the next alert.
Access the Alerts Detail screen
SQLdm provides several paths to access the Alerts Detail screen. The first access path is by clicking any row in the alerts roll up view of the Alerts tab. The second access path is by clicking the Show Alert link of a category icon that contains active alerts in the thumbnail or heatmap sub-views. It is also possible to access the Alerts Detail screen through the main SQLdm web console dashboard and specific widgets.