Inputting SQL to tune
Click the SQL button on the Overview tab to specify the source of SQL statements you want to tune.
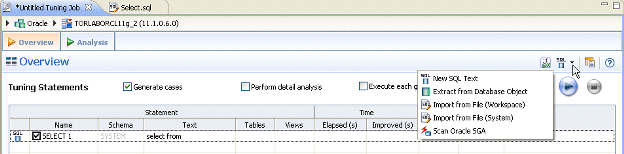
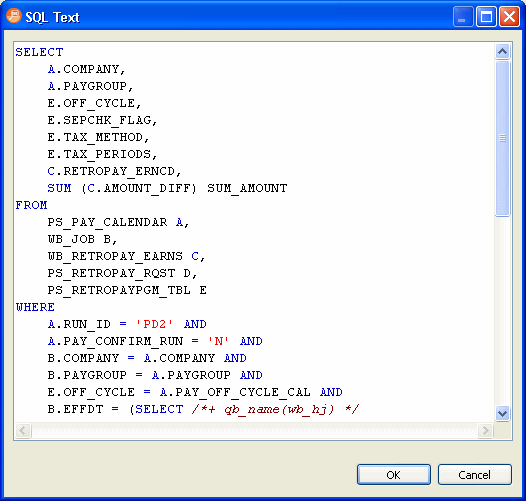
- New SQL Text: From the SQL button menu, select New SQL Text, and then copy/paste
SQL statements to the SQL Text dialog or write queries by hand and then click OK.
You can also input SQL by clicking anywhere in the Tuning Statements area and pressing Ctrl-V.
Once you have input the SQL and click OK, you can later edit the text by right-clicking an entry in the Tuning Statements area and selecting Edit.
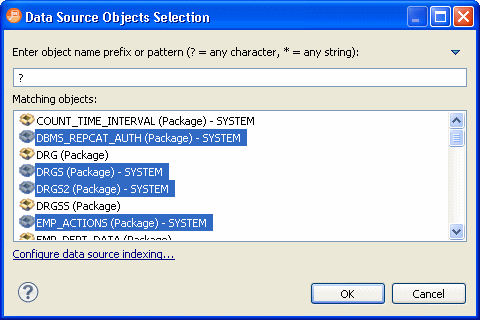
- Extract from Database Objects: Search for and then select (Ctrl-click) data base objects containing SQL that you want to tune from the selected data source. SQL Query Tuner will search through the database to find objects matching your input and presents matches for you to choose. In order for this option to work, you must enable Data Source Indexing in the properties for the database. If the data source has not already been indexed you will receive a message indexing that no indexing information is available. You can configure the database Properties dialog from the Data Source Objects Selection dialog by clicking Configure data source indexing....
For information on setting data source indexing properties, see Specify Data Source Indexing Preferences. - Import from File (Workspace) and Import from File (System): Browse the workspace or file system and select an SQL file from which to extract statements to tune.
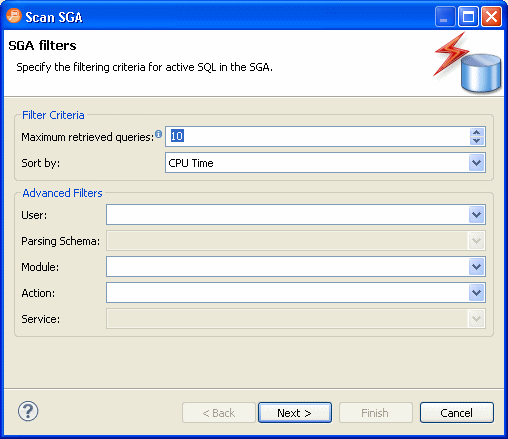
- Scan Oracle SGA: For the Oracle platform only, you can also scan the System Global Area (SGA) for statements to tune. Bind variables are extracted automatically.
- You can also drag and drop Materialized Views, Procedures, and Views from the Data Source Explorer to the Tuning Statements grid and they will be added to the list of statements to tune.
Running a tuning job
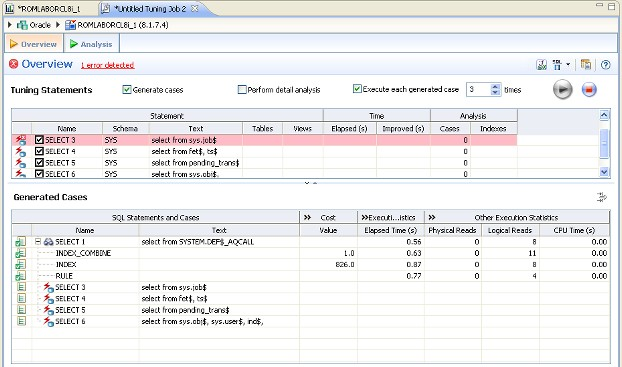
Once you click the Run Job icon on the top right-hand side of the Overview tab, the Overview tab provides the list of statements that were analyzed by the Tuner, as well as the cases suggested by the execution process to improve them. Additional information may include statement Name, Text, Source, Cost, and Elapsed Time values, depending on the platform.
Only the Elapsed Time statistic appears on all supported platforms. On Oracle, Execution Statistics and Other Execution Statistics columns will appear. When determining the best possible path using the Overview tab, it is best to use the Elapsed Time value as the guideline. The faster the path, the more optimized the query will become.
There are three tuning options to choose from before clicking Run Job:
- To analyze the SQL statement, click Generate cases.
- To perform the analysis that populates the Analysis tab now, click Perform detail analysis. Otherwise, the analysis tab is populated when you click the Analysis tab.
- To have the system generate execution statistics, click Execute each generate case and then select the number of time the system should execute each generated case. Multiple executions can verify that the case results are not skewed by caching. For example, the first time a query is run, data might be read off of disk, which is slow, and the second time the data might be in cache and run faster. Thus, one case might seem faster than another but it could be just benefiting from the effects of caching. Generally, you only need to execute the cases once, but it may be beneficial to execute the cases multiple times to see if the response times and statistics stay the same.
Creating tuning reports
After tuning SQL you can create an HTML or PDF Report of the tuning session. You can choose the details to include in the report.
- At the top right corner of the Tuning tab, click the Export Report button.
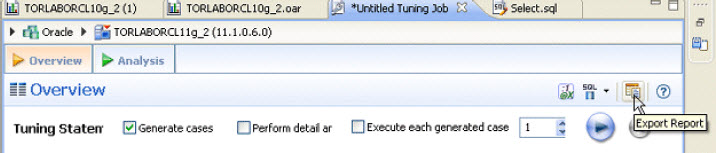
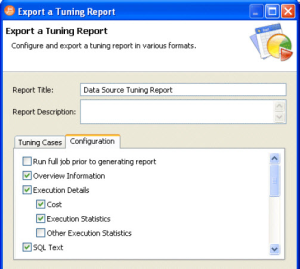
The Export a Tuning Report dialog appears.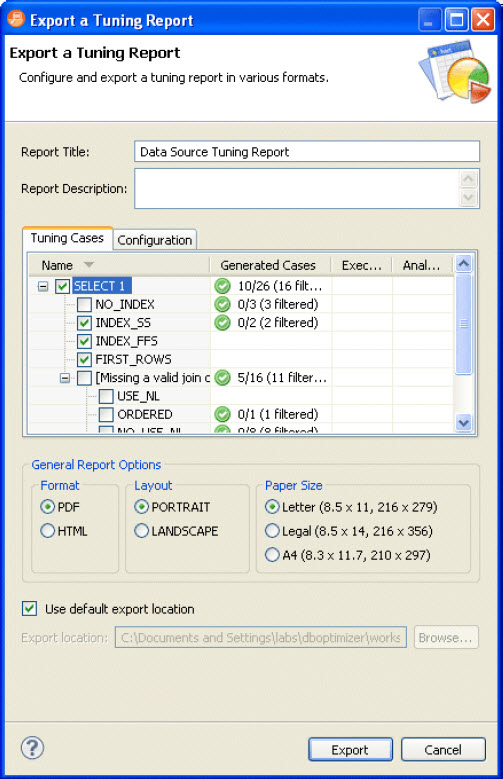
- Enter a Report Title and Description.
- On the Tuning Cases tab, choose the cases you want to report on. Click the + to expand the cases.
- On the Configuration tab, choose the content you want to include in the report.
- Select the General Report options, enter the location for the report, and then click Export.
You will see the progress of the report generation in the Progress pane.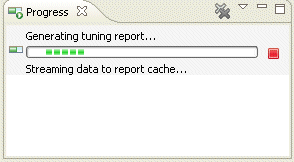
When complete, the report is stored at the top level of your workspace.
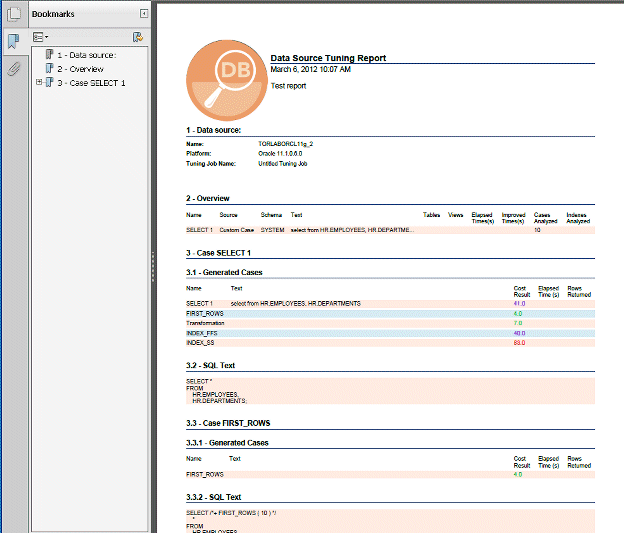
A report in PDF format will resemble the following: