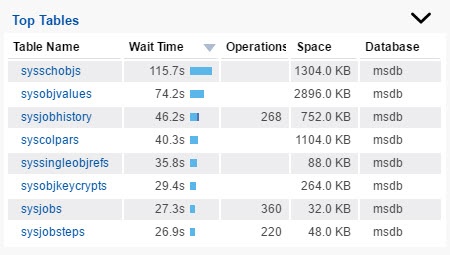
The Top Table chart, lists the table names followed by the Wait Time, the number of Operations, the used Space, and the Database name to where they belong.
Click your preferred table name to obtain more information and drill down to the table page.
On the left side of the table screen, you find a list of all the tables monitored in the selected database. This list helps you to have a faster access to other tables.
IDERA Website | Products | Buy | Support | Community | About Us | Resources | Legal