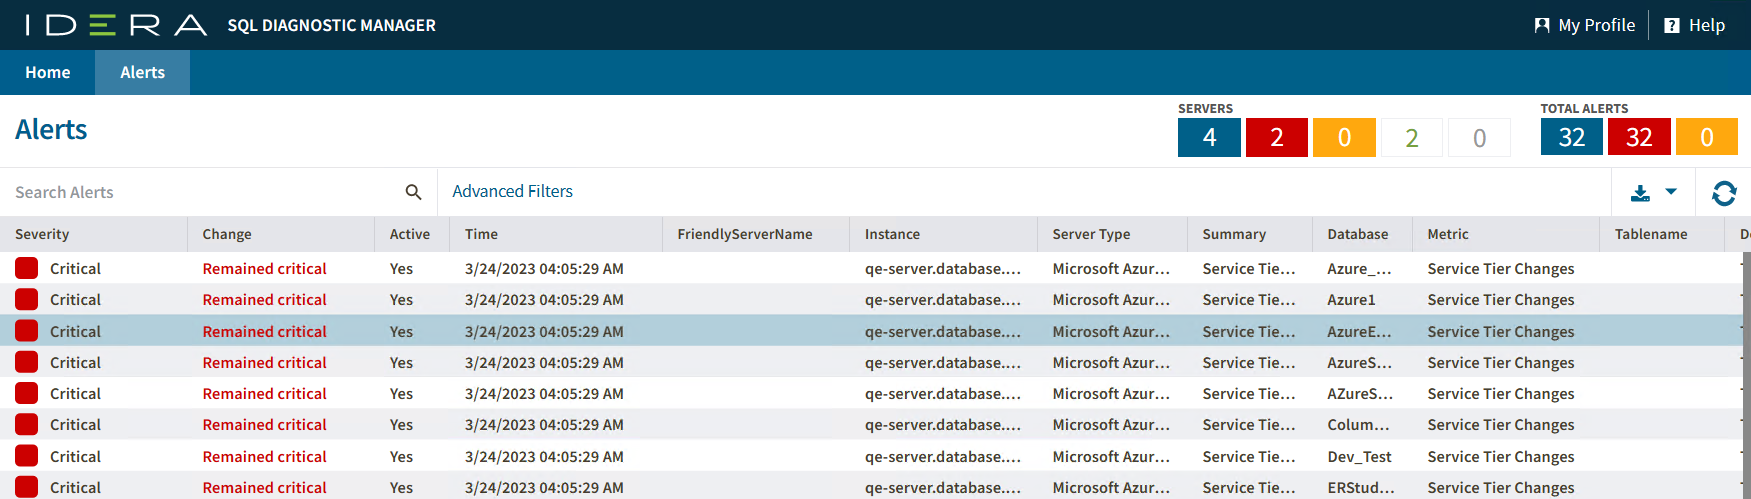
SQLDM Web Console allows you to view all the triggered alerts in a single view in your server's environment, to access this view go to the Alerts tab.
Monitor your alerts by status server
The Alerts tab gives you a summary of the number of servers and alerts of your SQL Server instances grouped by the status server. You can find the status server overview at the right top of the SQLDM Web Console.

Selecting one of the server status options allows you to filter your alerts. Each option represents a status server:
 All Servers - All SQL Server instances added to your SQL Diagnostic Manager environment
 Critical - Instances with at least one critical alert
 Warning - Instances with at least one warning but no critical alerts
 Ok - Instance with no alerts
 Maintenance - Servers that are in maintenance
Organize your alerts
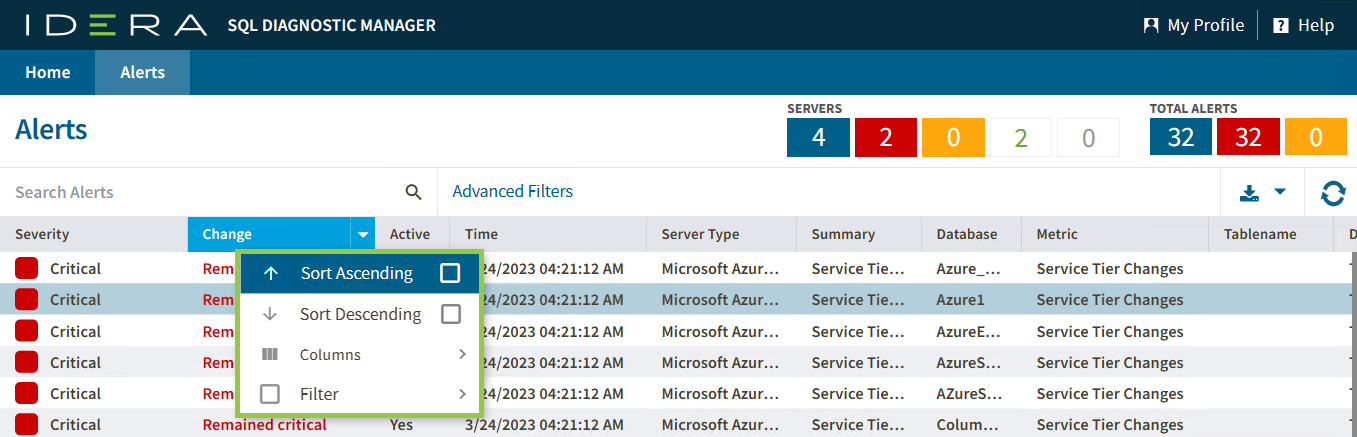
The SQLDM Web Console has custom filters and fort options that help you organize your alerts in your most convenient way.
Click the ![]() icon located next to the column name to expand the drop-down menu. This menu allows you to sort your criteria by Sort Ascending or Sort Descending, you can remove or add columns, and filter information by column criteria.
icon located next to the column name to expand the drop-down menu. This menu allows you to sort your criteria by Sort Ascending or Sort Descending, you can remove or add columns, and filter information by column criteria.
Your alerts are organized under the following columns:
- Severity
- Active
- Time
- FriendlyServerName
- Instance
- Server Type
- Summary
- Database
- Table name
- Details
- Metric
- Category
- SQLdmRepository
Additional options
- Access the Alert Details by clicking any field of an alert row.
- Filter your alerts with the Advanced Filter by clicking it.