Is the database idle, working, or bottlenecked?
When a bottleneck happens how can you know which of these problems are causing the problem? A bottleneck could be caused by:
- An application problem
- An undersized machine
- SQL requiring optimization
- A misconfigured database
All of these can be easily identified from SQL Query Tuner's performance profiling screen. Let's look at the components of the performance profiling screen.
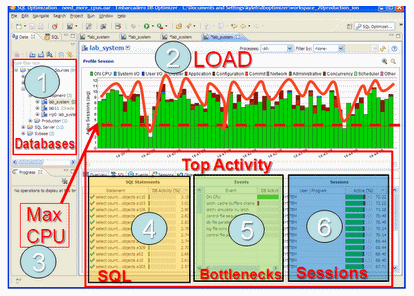
The screen has six important parts.
- Databases. For more information, see Databases.
- AverageActiveSessions(AAS)Loadofselecteddatabase. For more information, see Average Active Sessions (AAS) Load of selected database.
- MaximumCPUline. For more information, see Maximum CPU line.
- TopSQL. For more information, see Top SQL, Top Bottlenecks, and Top Sessions.
- TopBottlenecks. For more information, see Top SQL, Top Bottlenecks, and Top Sessions.
- TopSessions. For more information, see Top SQL, Top Bottlenecks, and Top Sessions.
Databases
First, on top left, is a list of our databases we have registered.
AverageActiveSessions(AAS)Loadofselecteddatabase
The most important part of the screen is the Average Active Sessions (AAS) graph. AAS shows the performance of the database measured in the single powerful unified metric AAS. AAS easily and quickly shows any performance bottlenecks on the database when compared to the Maximum CPU line. The Max CPU line is a yardstick for performance on the database. When AAS is larger than the Max CPU line there is a bottleneck on the database. Bottleneck identification is that easy.
AAS or the average number or sessions active, shows how many sessions are active on average (over a 5 second range in SQL Query Tuner) and what the breakdown of their activity was. If all the users were running on CPU then the AAS bar is all green. If some users were running on CPU and some were doing IO, represented by blue, then the AAS bar will be partly green and partly blue.
MaximumCPUline
The line "Max CPU" represents the number of CPU processors on the machine. If we have one CPU then only one user can be running on the CPU at a time. If we have two CPUs then only 2 users can be on CPU at any instant in time. Of course users can go on and off the CPU extremely rapidly. When we talk about sessions on the CPU we are talking about the average number of sessions on CPU. A load of one session on the CPU thus would be an average which could represent one user who is consistently on the CPU or many users who are on the CPU for short time periods. When a CPU becomes a resource bottleneck on the database we will see the average active sessions in CPU state go over the Max CPU line. The number of sessions above the max CPU line is the average number of sessions waiting for CPU.
The Max CPU is a yardstick for performance on the database.
From looking at the previous chart the problem is a machine resource problem.
TopSQL, TopBottlenecks, and TopSessions
In order to know what the problem is, we have to find out where that demand is coming from. To find out where the demand is coming from we can look at Top SQL and Top Session tables below the load chart. In our case shown here the load is well distributed over all SQL in Top SQL and all sessions in Top Session. There is no outlier or resource hog. In this case it's the machine that's underpowered. What does a case look like where we should tune the application? The following screenshot depicts such a problem.
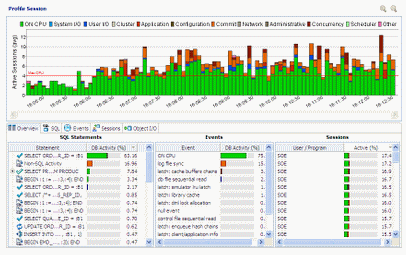
In this case, again the CPU demand is more than the machine can supply but if we look at "Top SQL" we can see that the first SQL statement (with the large green bar) uses up much more CPU than any of the rest, actually 60%! If we could get it down to 10% CPU then we'd save 50% of the CPU usage on the machine! Thus in this case it's worth our while to spend a day or week or even a couple weeks trying to tune that one SQL statement instead of buying a bigger machine.
Finally, how do we know when the database configuration is a problem? We know it's a configuration problem when we are seeing something other than CPU as the bottleneck in Top Bottleneck section. Here's an example
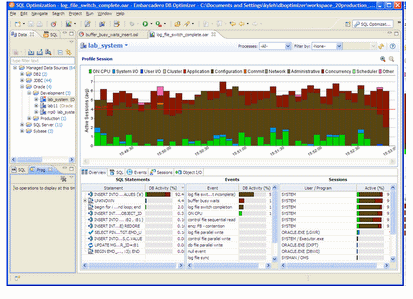
In this case we can see the load is higher than the Max CPU line but the load is coming from brown colored bars and the green CPU colored bars. If we look at Top SQL we see that there is only one SQL taking up almost all the load, but it's not because of CPU which would be a green bar, but some other color. What does this other color represent? We can look at the Top Bottleneck section and see that it is "log file switch (incomplete)" which basically means the log files are too small, the database is not correctly configured. This bottleneck can be resolved simply by increasing the log size.