In addition to the default viewing options provided by the views, profiling also provides the following features and functionality:
• Zooming In and Out. For more information, see Zooming In and Out.
• Filtering Results. For more information, see Filtering Results.
ZOOMING IN AND OUT
To zoom in or out on the Load Graph:
In the upper right-hand corner of the Load graph, click the Zoom In or Zoom Out icons, respectively.
NOTE: The Zoom In and Zoom Out commands are only available when a session has been stopped.
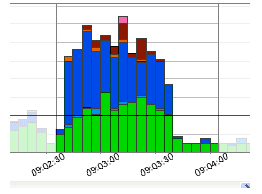
By default, the information contained on the Load Chart spans the entire length of the profiling session. You can select one or more bars of the graph to have the tabbed view populated with statistics for only the selected subset of the graph.
To display statistics for one or more bars on the graph, use one of the following methods:
Click-drag across one or more bars.