The SQL Profiler is composed of three essential diagnostic views that provide information about load on a particular database in the system. These views enable you to identify bottlenecks and view details about specific queries that execute and wait over the course of a profiling session.
The following describe the three components of SQL Profiler, in descending order of granularity:
Load Chart
The Load Chart provides an overview of the load on the system, and is designed as a high level entry point to reading session results. The colored bars represent individual aspects of the database, and the graph can be used to discover bottlenecks.
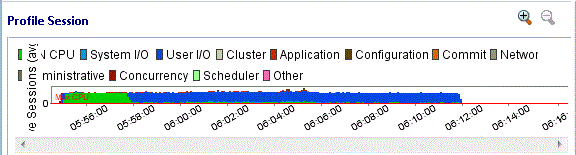
Time is displayed on the X axis, and the Y axis shows the average number of sessions waiting or executing. Each support platform type has a specific set of wait event times. For example, Sybase platforms will display CPU, Lock, Memory, I/O, Network, and Other categories. Use the chart legend to understand the graph. It displays a color and code scheme for executing and waiting session categories in the upper right-hand corner of the chart.
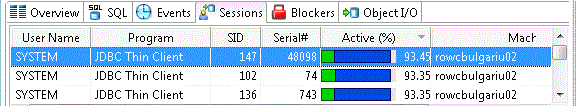
Top Activity
Below the Load Graph, the Top Activity section displays where the load originates and outlines items such as the top SQL statements, top events, and the top activity sessions on the database. It is composed of a series of DBMS platform-specific tabs that provide detailed statistics on individual SQL statements and sessions that are waiting or executing over the length of the profiling session.
While available tabs differ by platform, the most common are:
- The Overview tab provides summary information about SQL statements and events and their activity levels, and sessions, their system process IDs and their activity level. You can reorder the rows in any of the three sections of this tab. For example, clicking the Event column in the Events section changes the alphabetical order to ascending or descending.
- The SQL tab provides information about SQL statements and procedures. This includes all INSERT, SELECT, DELETE, and UPDATE statements that are executing or waiting to execute over the length of the profiling session.
- The Events tab displays information about wait events, and should be used to tune at the application or database configuration level. For example, if the top events are locks, then application logic needs to be examined. If the top events are related to database configuration, then the database setup should be investigated.
- The Sessions tab displays information about sessions, and can be used to discover sessions that are very active or bottlenecked.
- The Object I/O tab provides information about I/O when profiling an Oracle data source.
- The Procedures tab provides information about the procedures running in the session when profiling a SQL Server or Sybase data source.
Profiling Details
When you select any item from Top Activity, details are displayed on the Profiling Details view.
You may have to select Windows > Show View > Profiling Details to display the Profiling Details view.
The tabs that compose the Profiling Details view are dependent on the nature of the object selected in Top Activity, in order to reflect that item’s specific information. The tabs are also dependent on the data source platform. For example, the Object I/O tab is available only for the Oracle platform whereas the Procedures tab is available only for the SQL Server, Sybase, and Oracle platforms.
Depending on the data source platform you have specified, the tabs that appear in the view will be different, in order to accommodate the parameter specifics of the statement you have selected.
Depending on the top activity selected and the profiled platform types, some tabs may not be available.
When right-clicking on a SQL statement in the Top Activity section in the SQL Profiler, if the SQL statement is run by a different user than the user who is running DB Optimizer, then the User Mismatch dialog appears, with an example of the following message: "This query was executed by [SOE] and you are currently connected as [system]. We recommend you reconnect as [SOE] to tune the SQL. Would you like to continue anyway?" This message indicates that the statement is being tuned by a user other than the user who originally ran the query, and tables may be missing based on the different schemas. Click OK to run the query, or click Cancel and run the tuning job under the original user.
View Session Details
To view session details
- In the Profile Session area of the SQL Profiler, in the Sessions column, click anywhere in the row of an application that ran during the profiling session.
- In the Profiling Details area, click the Sessions tab.
Details of the session are displayed.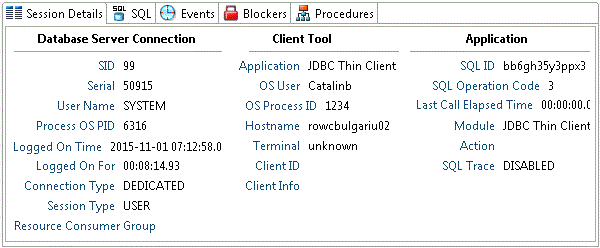
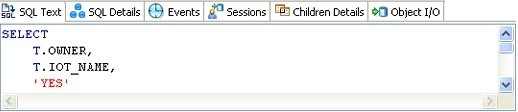
View SQL
To view SQL
- In the Profile Session area of the SQL Profiler, click anywhere in the row of an application that ran during the profiling session.
In the Profiling Details area, click the SQL Text or SQL tab.
The associated SQL text is displayed.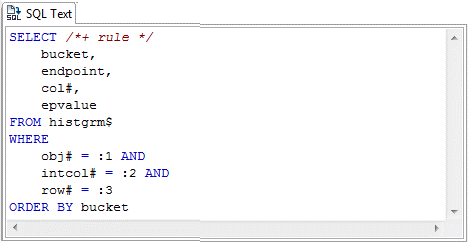
From the SQL tab you can easily tune a statement by right-clicking a statement on the SQL tab to initiate the tuner, which then opens with the selected statement in the Ad hoc SQL tab of the Tuner Input.