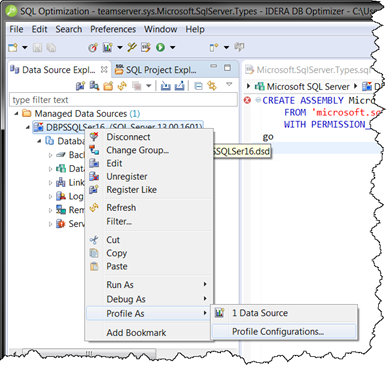
To analyze and tune statements on data sources within your enterprise, you must access the data source objects within the application. It is important to view databases and underlying code in an organized manner, especially when maintaining a large system. Data Source Explorer’s tree structure can be used to view databases, tables, and other information about data sources. Expand the nodes of each registered data source to view details about each data source. Data Source Explorer is also used to launch profiling sessions, by enabling you to select the data source that you want to execute, and then launching a profiling session from your selection.
The Data Source Explorer tree provides a list of databases, and enables you to launch Optimizer features, such as SQL Profiler, via the context menu. All objects listed in Data Source Explorer are sorted by data source name. Additionally, you can view the underlying SQL code for an individual database object.
To browse a data source
- Expand a data source node, providing credentials if prompted.
- Expand additional subnodes to drill down through object types and then individual objects.
- Double-click the Code subnode for a particular object to view the code in SQL Editor.
Notice in the previous screenshot, there are Profiling Repositories listed in the Data Source Explorer. For Oracle data sources only, you can save your profiling sessions to the Profiling Repository for later examination. We’ll discuss this more later in Saving a Profiling Session.
